Quick summary: Operating's February 2026 update adds portfolio-level profitability reporting, including a Gross Margin report and a new Revenue per Hour metric that compares performance across time-and-materials and fixed-price projects. Fixed-price projects gain progress-based revenue recognition through a Set Progress dialog, so recognized revenue follows actual delivery rather than time elapsed. A new Active Projects report gives a lightweight invoicing view of hours, revenue, and invoiced versus uninvoiced amounts, and the Model Context Protocol server entered closed beta.
Profitability reporting, Cmd+K improvements, lightweight invoicing, and more
February focused on making financial visibility and day-to-day navigation faster across Operating. This release introduces portfolio-level profitability reporting, improvements to the Cmd+K launcher, a simpler invoicing workflow, and several smaller updates that improve how teams manage projects, staffing, and time tracking.
Below is a breakdown of the most important updates.
Portfolio-Level Profitability Reporting
Understanding project profitability should not require digging through individual project pages. The Project Portfolio now includes a Gross Margin report, giving leadership and finance teams a clear portfolio-level view of how projects perform financially.
You can now review profitability across all projects directly in the Portfolio view, using the same grouping and filtering options already used for revenue, utilization, and project staffing analysis.
This makes it easier to answer questions like:
- Which clients generate the strongest margins?
- Which business units or offerings are underperforming?
- Which project types consistently deliver healthy profitability?
Instead of reviewing projects one by one, you can now evaluate margin performance across the entire portfolio in seconds.
Revenue per Hour: A New Core Performance Metric
A new Revenue per Hour metric is now available in Project Portfolio reporting. It provides a simple, comparable indicator of project performance across different pricing models.
This metric works across:
- Time and Materials projects
- Fixed-price projects
- Different clients or business units
Revenue per Hour can be used in two ways:
- Backward-looking: based on actual tracked hours and recognized revenue
- Forward-looking: based on planned allocations and expected revenue
You can also display:
- Planned Revenue per Hour
- Earned Revenue per Hour
directly in the Projects list as columns. This allows teams to quickly compare project performance without opening individual project pages.
More Financial Data Across List Views
We have expanded the number of financial columns available across list views to make quick financial checks easier.
In the Projects list, you can now display columns for:
- Actual revenue
- Actual costs
- Actual margin %
- Actual gross margin
- Total tracked hours
- Total planned hours
- To-date planned hours
- Invoiced amount
- Budget-spent percentage for T&M projects
These additions make the Projects list a much more powerful view for monitoring financial performance.
The Positions list also includes several new columns. Staffing managers can now quickly review financial health and workload distribution directly from the list view without opening individual position or project pages.
Profitability Visible in the Timeline
Project managers often spend most of their time working in the Timeline. With this update, profitability can now be displayed directly on allocation bars.
When enabled, each allocation shows both allocation percentage and gross margin percentage, for example:
100% – GM 25.4%
This allows project managers to keep financial performance visible while planning resource allocation and project staffing.
Grouping by Tag Category
Projects and positions can now be grouped by entire tag categories.
For example, you can group projects by categories like:
- Staffing Process
- Offering Area
- Delivery Stage
A staffing manager can open the Projects or Positions list, choose Group by Tag Category, and instantly organize work by workflow stage or internal classification.
This makes it easier to monitor project pipelines, staffing processes, and operational workflows.
Cmd+K Launcher Improvements
The Cmd+K quick launcher has been upgraded to make navigation faster and more discoverable.
Improvements include:
- Important options like Settings now appear more prominently
- You can type “Add” or “New” to create projects, people, or positions
- Typing “Permissions” jumps directly to permission settings
- Typing “HiBob” opens the integration settings
- Typing “help” opens the support site
- @me can now be used as a search option
- Projects can now be searched by their unique project ID
If no results are found, the launcher now shows a link to the help widget so users can quickly get assistance.
Progress-Based Revenue Recognition for Fixed-Price Projects
Finance teams often struggle to track revenue accurately on fixed-price projects. When revenue recognition is based only on time passed or hours logged, financial reporting can quickly drift away from the project’s real progress.
Operating now allows project managers to formally determine project progress, making revenue recognition reflect actual delivery progress rather than time elapsed.
Project managers can set a project’s completion percentage using the new Set Progress dialog.
In this dialog, you can:
- Select the date for the progress update
- Review the current revenue and progress percentage
- Enter the actual completion value, either as a percentage or in currency
Once saved, the system adjusts recognized revenue over time and updates reporting accordingly.
For finance managers and accounting teams, this provides a more reliable foundation for:
- Revenue recognition reporting
- project profitability analysis
- forecasting expected revenue
- monitoring fixed-price project performance
Instead of waiting until the project closes or manually adjusting financial reports, finance teams can rely on progress-based revenue recognition that reflects how work is actually advancing.
This improves visibility across project portfolios and helps reduce discrepancies between project delivery and financial reporting.
Lightweight Invoicing Workflow
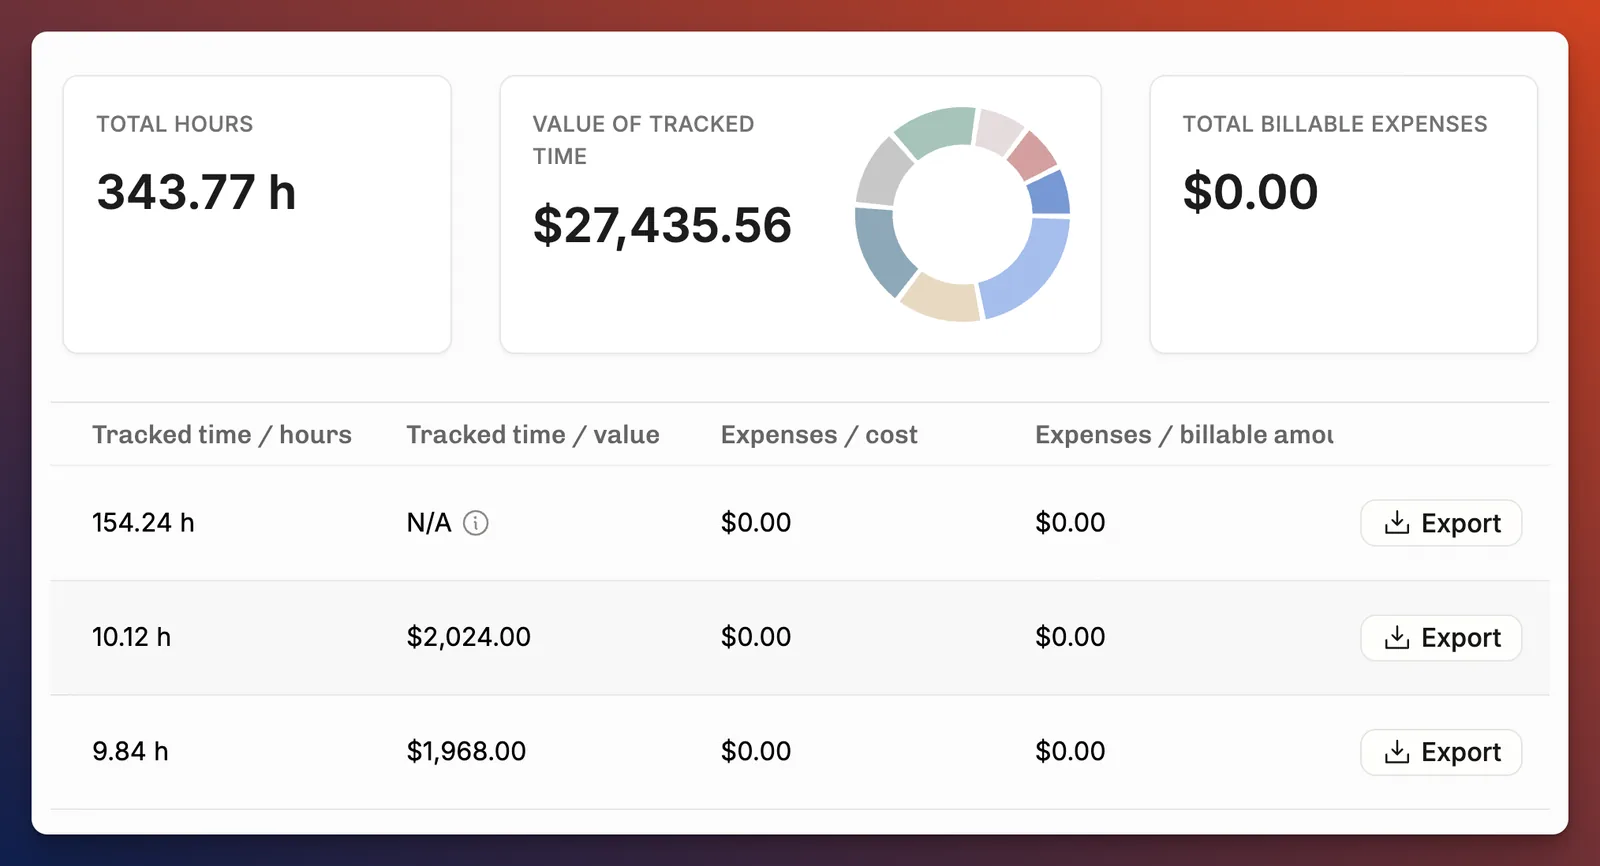
A new Active Projects report introduces a faster way to review work completed during a billing period.
The report shows a filterable table of projects with tracked hours during a selected time period. Results are grouped by client and include columns for:
- Hours worked
- Revenue generated
- Invoiced amounts
- Uninvoiced amounts
You can filter the report by:
- Billable vs non-billable hours
- Project filters
- Grouping preferences
From the report, you can:
- Export time entries as CSV
- Generate a work breakdown PDF
- Optionally include expenses
This workflow is useful for teams that want a quick monthly overview of billable work without going through a full invoice creation process.
Smaller Improvements Worth Mentioning
Several smaller updates also improve everyday workflows.
User-selected date locale
Each user can now choose their preferred date display format from View Options, independent of browser settings.
Projected margin on project cards
The margin KPI shown on project cards and timelines now displays projected margin by default. This combines actuals up to today with planned values going forward, instead of showing “Actual margin: N/A” for incomplete projects.
Project Completion column
A Project Completion % column is now available in the Projects list for fixed-price projects. It displays progress based on the project’s revenue recognition and progress determination data.
Revenue added to reporting APIs
Revenue fields are now available in the reporting APIs, for example in the Projects Actual report endpoint.
Financial display fixes
Several calculation and display issues in the project detail page’s financial status section have been resolved.
Automatic cost calculation for time entries
Every tracked time entry now automatically includes cost calculations based on:
- Cost card
- Site
- Role
- Seniority
- External or internal status
Costs are calculated in:
- The actual currency
- The project currency
- The tenant’s default currency
Bulk deletion of time entries
You can now select and delete multiple time entries directly from the Time Entries list. Previously, bulk deletion required contacting support.
Experimental: LLM-Powered Reporting via the MCP server
We've published our MCP server to a closed beta. This enables LLM-powered interaction with Operating.
This allows you to prompt the system for things like:
- Custom reports directly in Excel
- Resource recommendations in Claude or ChatGPT
- Expertise discovery within your team
- Building time tracking AI agents that automatically fill timesheets in Operating based on activity in other tools
- Project health tracker
- Proactive Slack notifications e.g. for missed timesheets
If you want to test it, send a message to support@operating.app and we will give you access.
Final Thoughts
This update focuses on giving consulting and operations teams faster access to the data that matters most. Portfolio-level profitability reporting, better financial visibility across views, and simpler invoicing workflows all help teams stay on top of margins and project performance.
If you want to see how these updates support better resource planning, project staffing, and financial management, you can explore them directly inside Operating.'
FAQ
What’s new in Operating’s February 2026 product update?
The update introduces portfolio-level profitability reporting, progress-based revenue recognition for fixed-price projects, and a new Active Projects report for lightweight invoicing.
How does the new profitability reporting work?
The Project Portfolio now includes a Gross Margin report and Revenue per Hour metrics, along with new financial columns across Projects and Positions for faster profitability analysis.
What is Revenue per Hour and why does it matter?
Revenue per Hour is a comparable performance metric across projects and pricing models. It uses tracked hours and recognized revenue, or planned allocations and expected revenue, to measure project performance.
How does Operating support revenue recognition for fixed-price projects?
Project managers can set a project’s completion percentage on a specific date. This allows revenue recognition to reflect actual project progress instead of time passed, helping finance and accounting teams report revenue more accurately for fixed-price consulting projects.
How does Operating help finance and accounting teams?
Operating gives finance teams visibility into project profitability, revenue recognition, and billable performance. Metrics like gross margin and Revenue per Hour help monitor consulting revenue and project financial health.
What is the Active Projects report used for?
It provides a simple overview of projects with tracked time during a selected period, showing hours worked, revenue generated, and invoiced versus uninvoiced amounts.
Is Operating an AI-powered PSA (professional services automation) software?
Yes. Operating includes AI capabilities such as the AI helper Ope and an MCP server that connects with tools like ChatGPT, Claude, Gemini, and Microsoft Copilot for tasks like custom reporting and knowledge discovery.