Project budgets that price in revenue, cost, and margin from the start

Budget fees, labor and expenses before the work starts, and see planned revenue, cost and margin before kickoff.
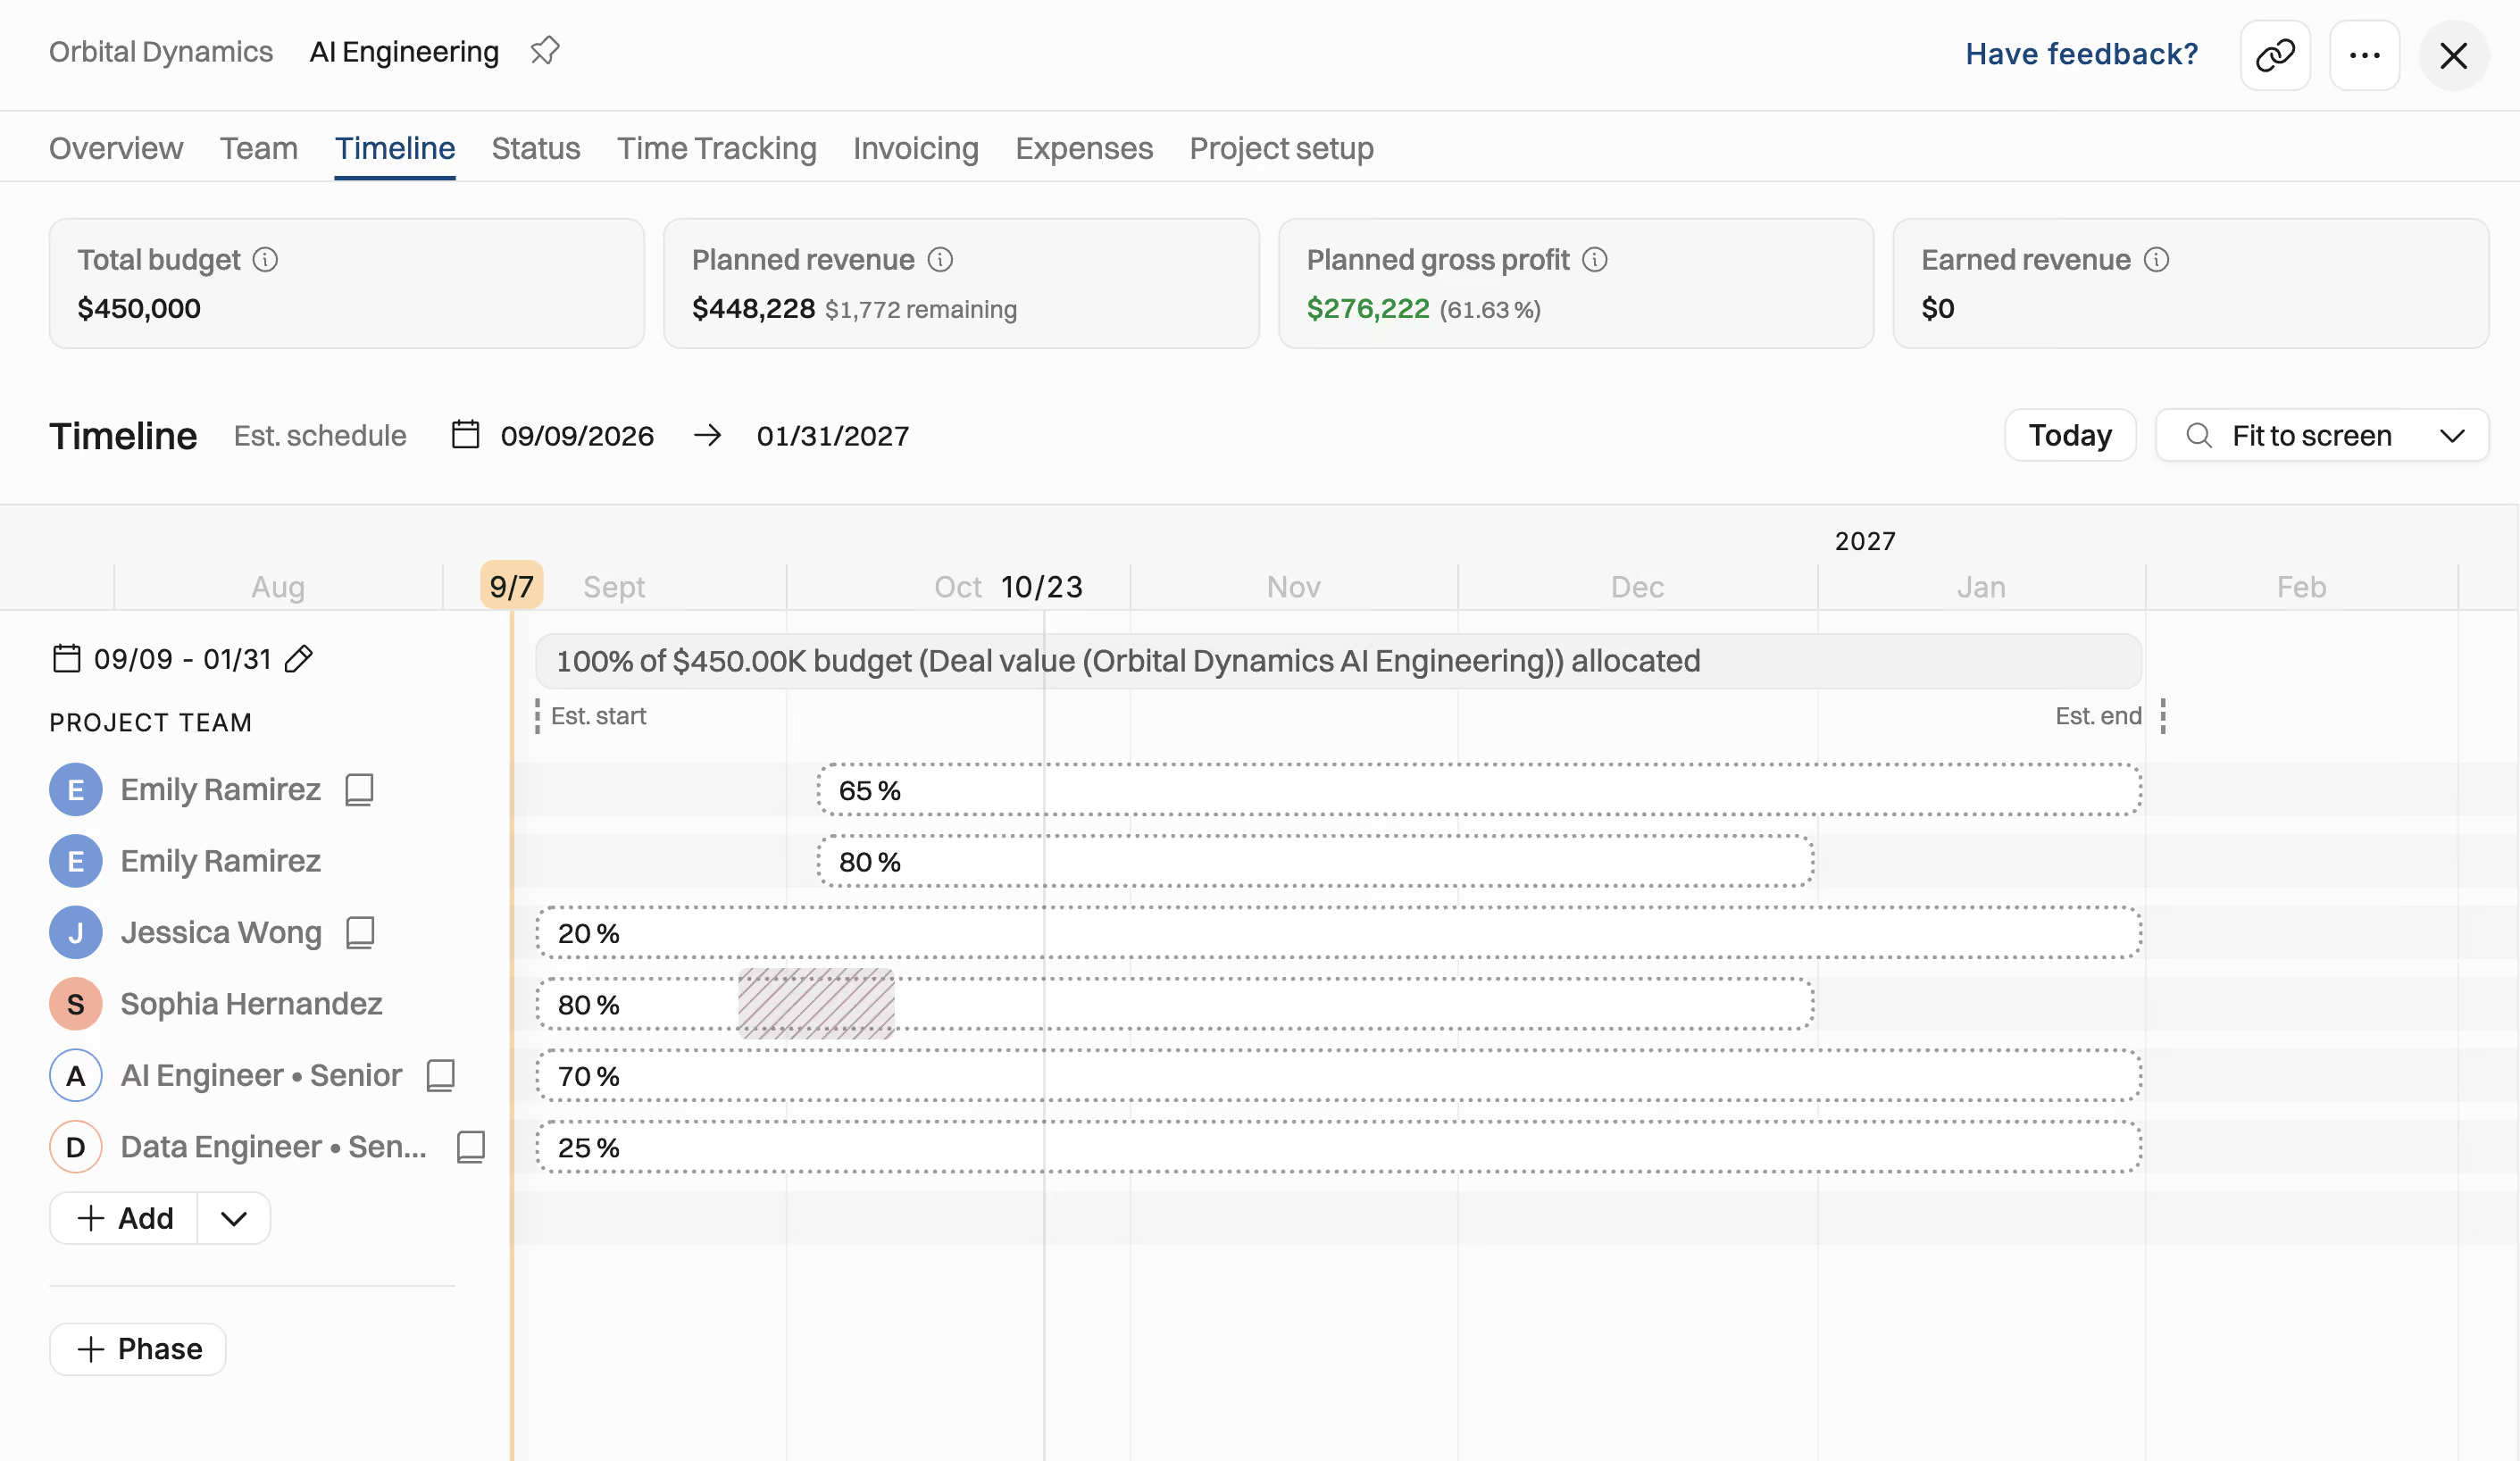
Project timeline for Orbital Dynamics AI Engineering from September 9, 2026, to January 31, 2027, showing planned budget, revenue, and gross profit. The timeline lists team members Emily Ramirez, Jessica Wong, Sophia Hernandez, AI Engineer Senior, and Data Engineer Senior with individual progress percentages ranging from 20% to 80%. Budget details include a total of $450,000, planned revenue $448,228 with $1,772 remaining, planned gross profit $276,222 at 61.63%, and earned revenue $0.

Fees and costs in one budget

Price the project with fixed price fees, charge-out rates, and people cost rates and rate cards. Add planned expenses to fully understand margin.

Budget the deal before it closes

Pipeline projects get budgets too: placeholder roles carry rates and costs, and deal value flows in from your CRM.

Sketch fast, refine when it matters

Rough out a plan in minutes, refine it into phases, and compare planned margin across every upcoming project. Use AI to do this with one prompt.

Fees and costs, labor and expenses

Plan the people and price them two ways at once — cost rates for what the work costs you, rate cards for what it earns on time-and-materials. On fixed price, the budget sets the top line. Add planned expenses, and the estimate is the whole project, not just the hours.

Labor priced from cost rates (bottom line) and rate cards (top line)

Fixed price, time-and-materials, capped or retainer — the billing model sets where revenue comes from

Planned expenses included: subcontracting, travel, hotels, and the rest
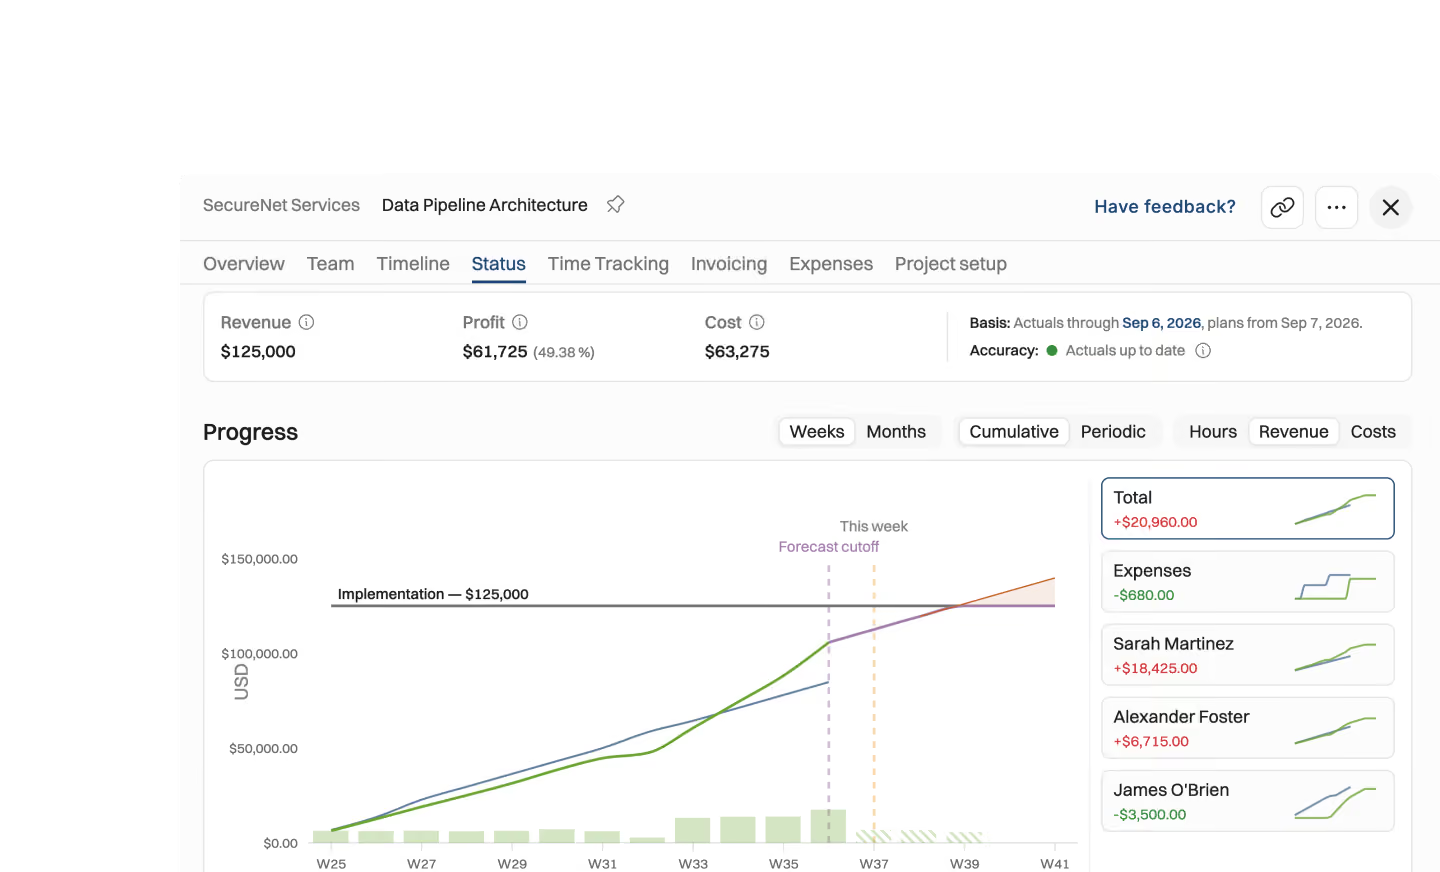
Project burnup chart for SecureNet Services Data Pipeline Architecture showing revenue of $125,000, profit of $61,725 (49.38%), and cost of $63,275. The chart tracks progress in USD with a green line representing actuals and a purple line showing forecast cutoff. The chart covers weeks from W25 to W41. The profit and expenses are itemized: Total -$20,960, Expenses -$680, Sarah Martinez +$18,425, Alexander Foster +$6,715, James O’Brien -$3,500. Tabs include Overview, Team, Timeline, Status (selected), Time Tracking, Invoicing, Expenses, and Project setup. Basis notes actuals through Sep 6, 2026, and plans from Sep 7, with accuracy indicated as actuals up to date.Star map with constellations connected by thin white lines on a dark blue background.Vintage-style star map with black dots connected by lines showing constellations on beige background.Blue background with scattered white spots resembling paint splatters or stars.Blue-gray background with scattered small white spots resembling a starry night sky.Gray background with scattered white spots resembling paint splatters or stars.

Budget the deal before it closes

Pipeline projects get budgeted from the start. Plan with placeholder roles that carry costs and rates from your rate cards, and once a named person is staffed, their own cost rate takes over. Deal value flows straight in from your CRM.

Tentative pipeline projects budgeted

Add in just the project fee or the full team for revenue forecasting

Placeholder roles carry rates and costs until someone is staffed

Budget prefilled from deal value — HubSpot, Pipedrive, or Salesforce
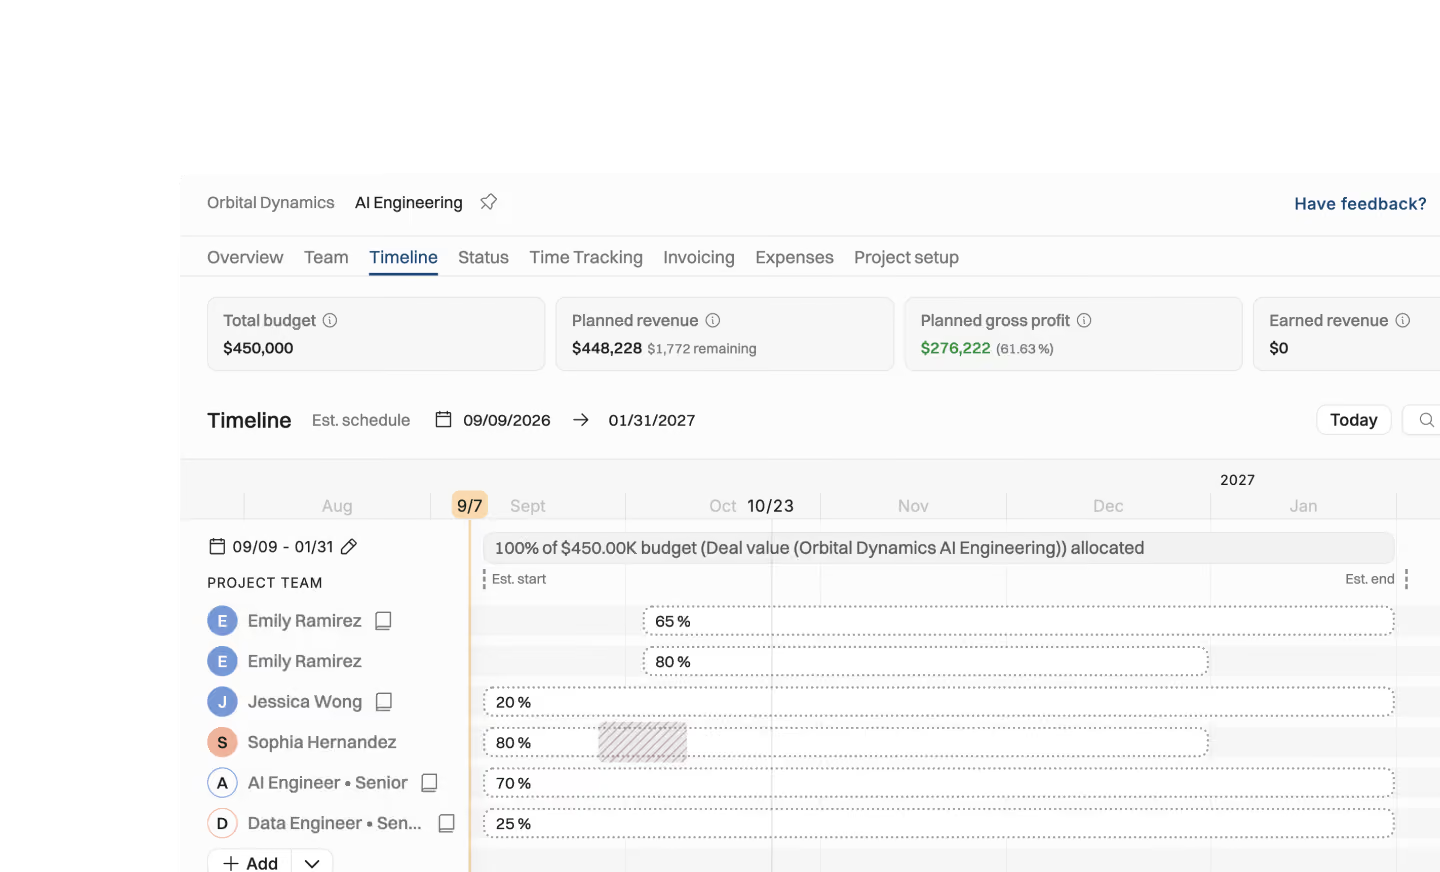
Project management dashboard for 'Orbital Dynamics AI Engineering' showing a timeline view with a total budget of $450,000, planned revenue of $448,228 with $1,772 remaining, planned gross profit of $276,222, and earned revenue of $0. The timeline runs from September 9, 2026, to January 31, 2027, and displays task progress bars for the project team members Emily Ramirez, Jessica Wong, Sophia Hernandez, AI Engineer Senior, and Data Engineer Senior, with percentages reflecting task completions such as 65%, 80%, 20%, 70%, and 25%.Star map with constellations connected by thin white lines on a dark blue background.Vintage-style star map with black dots connected by lines showing constellations on beige background.Blue background with scattered white spots resembling paint splatters or stars.Blue-gray background with scattered small white spots resembling a starry night sky.Gray background with scattered white spots resembling paint splatters or stars.

From broad strokes to detailed project margin

Rough out a plan in broad strokes to sanity-check a deal, then refine it into phases and varying workloads as it firms up. Across the portfolio, one list shows every upcoming project with its planned revenue, cost, and profit.

High-level sketches and refined plans in seconds with AI

Support for project phases and task-level planning

Every upcoming project's planned revenue & profit in one list view

Compare planned margins across projects before committing people
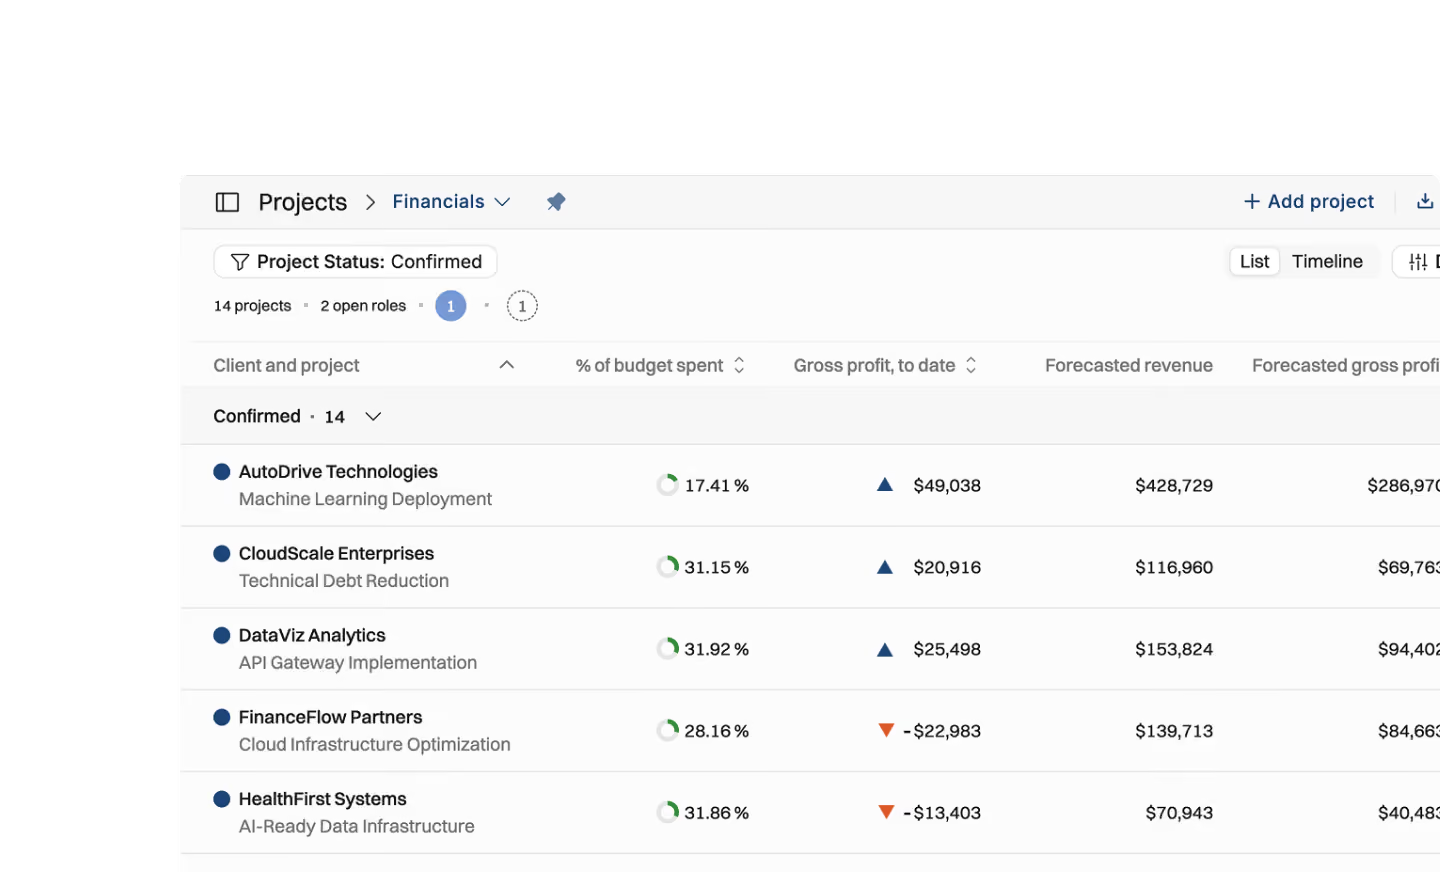
Screenshot of a project financials dashboard listing five confirmed projects with details: AutoDrive Technologies at 17.41% budget spent and $49,038 gross profit; CloudScale Enterprises at 31.15% budget spent and $20,916 gross profit; DataViz Analytics at 31.92% budget spent and $25,498 gross profit; FinanceFlow Partners at 28.16% budget spent with a negative gross profit of -$22,983; HealthFirst Systems at 31.86% budget spent with a negative gross profit of -$13,403. Columns include percentage of budget spent, gross profit to date, forecasted revenue, and forecasted gross profit.Star map with constellations connected by thin white lines on a dark blue background.Vintage-style star map with black dots connected by lines showing constellations on beige background.Blue background with scattered white spots resembling paint splatters or stars.Blue-gray background with scattered small white spots resembling a starry night sky.Gray background with scattered white spots resembling paint splatters or stars.

Why budget with both rates and costs?

A budget that only tracks fees can't tell you what the work costs.

A white connected dot line forming an abstract constellation with a yellow star on black background.

Every role in the budget carries a cost rate (what the work costs you) and a billing rate from your rate card (what you charge the client), so the budget shows cost and revenue side by side. On fixed price, the agreed fee sets the revenue instead.

Labor is only part of the picture. Subcontracting, travel, and hotels are planned expenses too — leave them out and the estimate is just hours, not the project.

The same logic applies before a deal closes. Tentative pipeline projects deserve budgeting too, so placeholder roles carry rates and costs from your rate cards until someone is staffed, and then the named person's costs take over. Deal value comes straight from HubSpot, Pipedrive, or Salesforce.

Not every budget needs the same precision. Sketch a plan in broad strokes to sanity-check a deal, then refine it into phases and varying workloads once it firms up. Across the portfolio, one list shows every upcoming project with its planned revenue, cost, and profit, so you can compare margins before committing people.

Diagram of the Big Dipper constellation with stars connected by lines and a large star above.

Get the Operating Routine for resource planning

A weekly routine for staffing and capacity, written by people who ran it in their own firms. It gives your resource planning meeting a fixed agenda and a short list of numbers to check. Get the guide.

Submit

Thank you!

Get the Staffing Routine by clicking below.

Download guide

Oops! Something went wrong while submitting the form.
White radial lines extending downward on a solid dark blue background.

Get started

Talk with Lauri,
our CEO