


Resource utilization, tracked across the whole firm
Utilization is the number a consulting business stands on, and most firms compute it in spreadsheets, quarterly, too late to act. Operating tracks billable utilization live and lets you customize your own utilization formula.
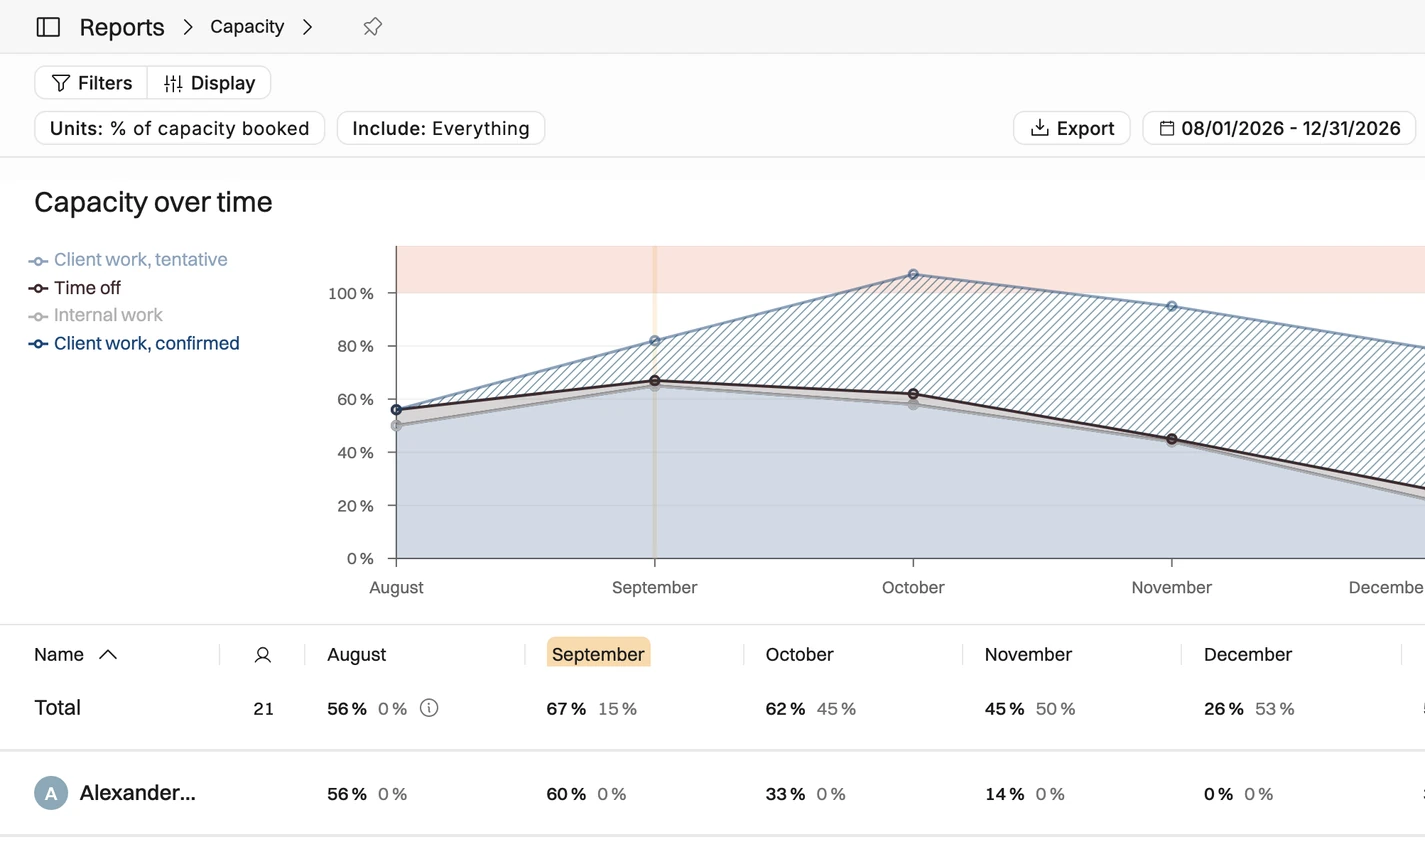

One utilization number
Billable and non-billable hours by person, team, or firm — straight from the timesheets, with no exports or formulas. We'll let you customize yours.

Planned vs actual utilization
Bookings show the utilization you're heading for and timesheets show what happened — side by side, while you can still act.

What utilization means in money
Effective rate per hour and margin sit next to utilization, so high hours on the wrong rates don't hide losses.
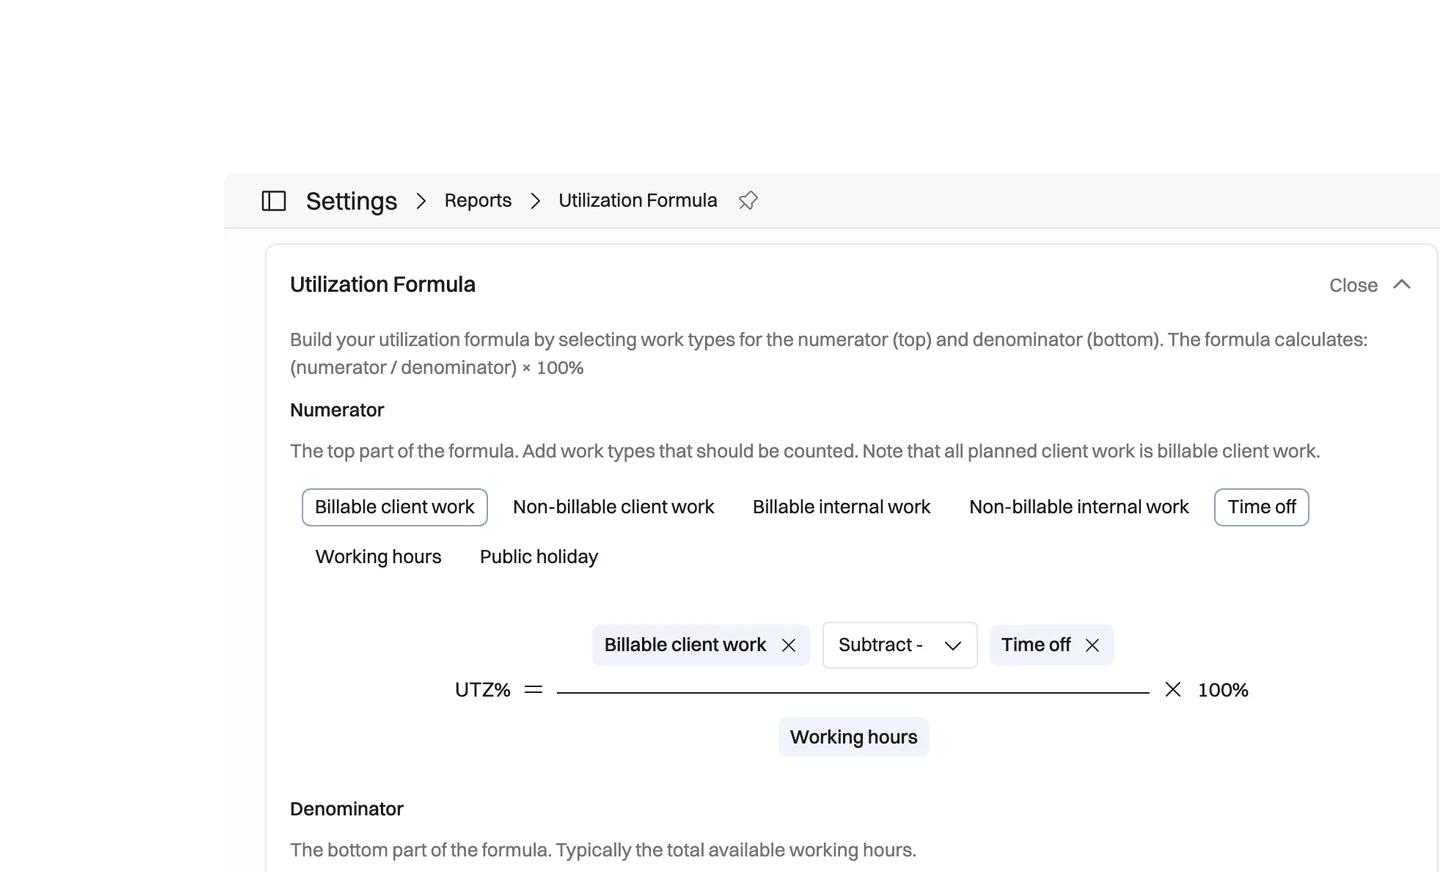
Customize the utilization formula
Billable and non-billable hours, by person, team, or the whole firm. No exports or formulas, and no arguing about whose spreadsheet is right — the number comes from the timesheets themselves.
Billable vs non-billable breakdown per person and team
Firm-wide rollups from the same source data
Live from approved timesheets, not month-old exports





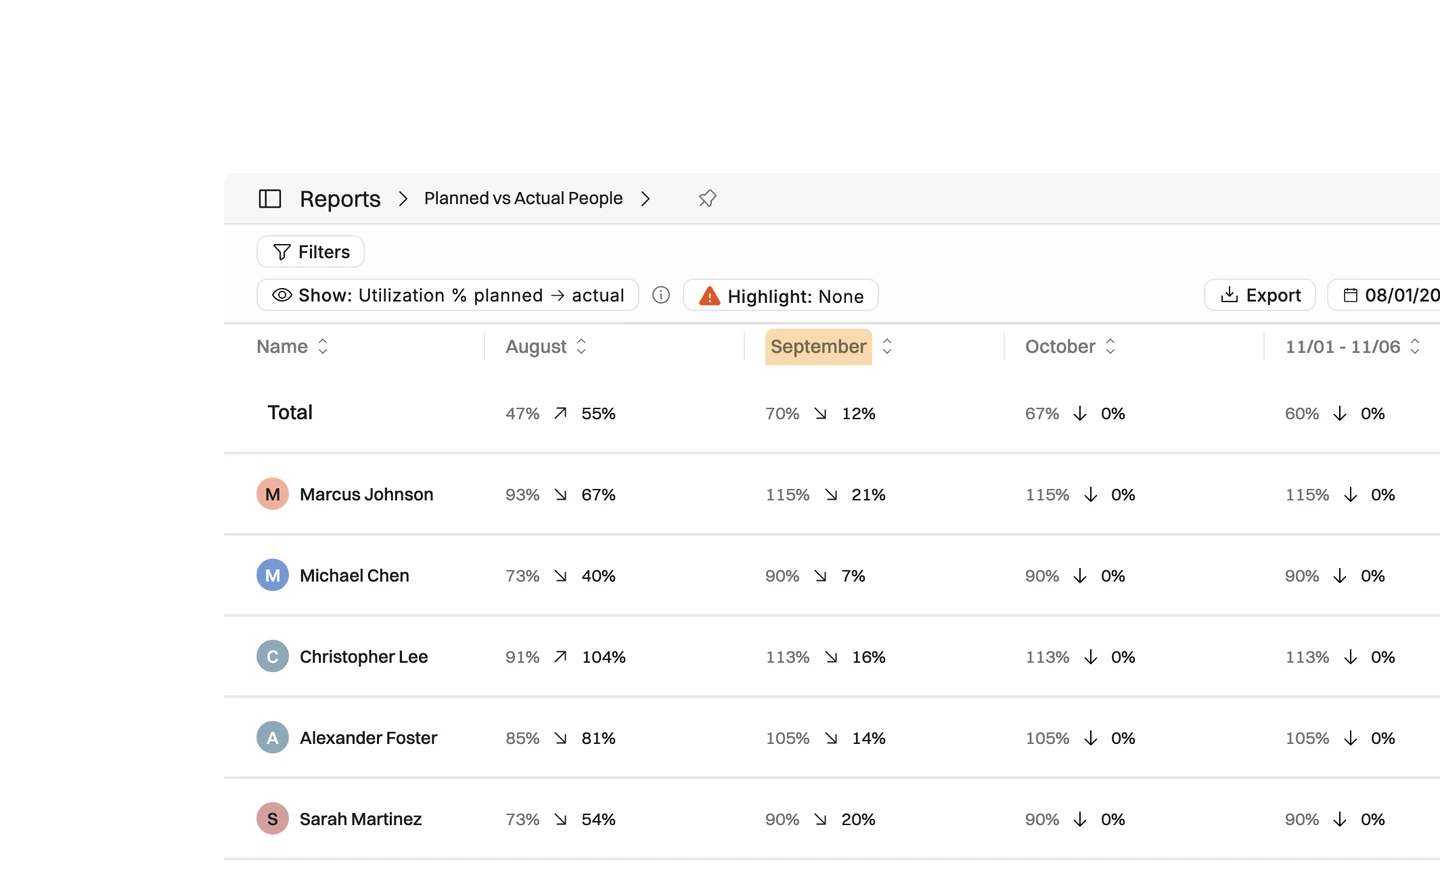
Monitor planned vs. actual utilization
Bookings tell you the utilization you're heading for; timesheets tell you what actually happened. Operating shows both side by side: next month's utilization while you can still change it, and where planned hours leaked away last month.
Planned utilization from bookings, weeks ahead
Actual utilization from approved timesheets, side by side
The gap (planned vs. actuals) made visible: booked hours that never got logged
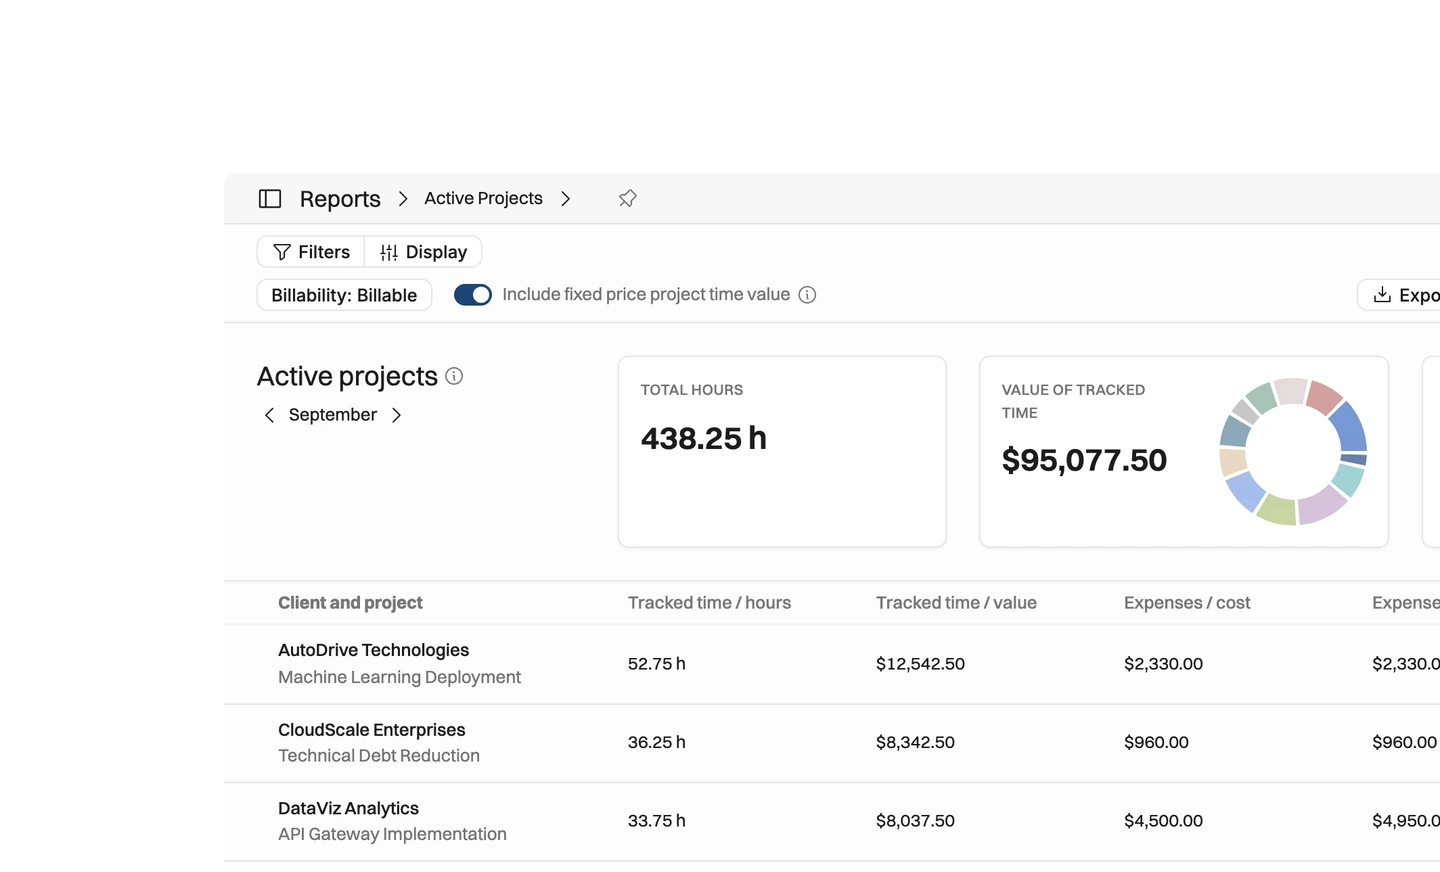
What utilization means in money
High utilization on the wrong rates still loses money. Operating ties hours to financials, so you see effective rate per hour and margin next to utilization — fixed-price projects included.
Effective hourly rate by person, project, and team
Margin shown next to the utilization that drives it
Works across time-and-materials and fixed-price alike
Why track utilization live, not quarterly?
Utilization computed quarterly in spreadsheets arrives too late to change anything.

Most firms rebuild the same number every quarter by exporting timesheets into a spreadsheet, and by the time the math is done the month it describes is over. Operating reads utilization from the timesheets themselves, so nobody argues about whose file is right.
A utilization number you can only read after the quarter closes is a report. One you can read next month is a decision.
That is why bookings sit next to timesheets here. Bookings show the utilization you are heading for weeks ahead, while it can still be changed; approved timesheets show what actually happened. The gap between them — booked hours that never got logged — is the part worth acting on.
The same reasoning puts money on the screen next to hours. High utilization on the wrong rates still loses money, so effective hourly rate and margin appear beside the utilization that drives them, by person, project, and team, across time-and-materials and fixed-price work alike.


Get the Operating Routine for resource planning
A weekly routine for staffing and capacity, written by people who ran it in their own firms. It gives your resource planning meeting a fixed agenda and a short list of numbers to check. Get the guide.
Thank you!
Get the Staffing Routine by clicking below.
Download guide
