
Short answer: Workload management in a consulting firm means checking, every week, that each person's planned work fits their real available hours, skills and role, and moving work before anyone runs above capacity for weeks in a row. Burnout risk rarely shows up in the average. It shows up in an uneven spread: a few trusted people carry the hardest work while the firm-wide utilization number still looks healthy. Measure load per person, set limits by role, watch early signals such as a growing overtime balance, and run a short weekly rebalancing review.
What Is Workload Management in a Consulting Firm?
Workload management is the practice of matching planned work to each person's available hours, skills and role, week by week, so nobody runs above capacity for long. It works at the level of named people and the next two to six weeks. The goal is delivery that is on time and also sustainable.
Capacity planning looks months ahead and asks whether the firm has enough of the right roles. Resource allocation decides who works on which project. Workload management asks a narrower question: is this person's week realistic, and will it still be realistic in three weeks? For the forecasting side, see our guide to agency capacity planning.
Why Consulting Teams Burn Out
Burnout is a work design problem, not a personal weakness. In ICD-11, the WHO describes burn-out as "a syndrome conceptualized as resulting from chronic workplace stress that has not been successfully managed". It has three dimensions: exhaustion, mental distance or cynicism about the job, and reduced professional efficacy. The WHO classifies it as an occupational phenomenon, not a medical condition (WHO, 2019).
Workload is one cause, but not the only one. Christina Maslach, who developed the Maslach Burnout Inventory, and Michael Leiter link burnout to mismatches in six areas of work: workload, control, reward, community, fairness and values (Maslach and Leiter, 2016). A Gallup study of nearly 7,500 full-time employees found a similar list. The top five factors linked to burnout were unfair treatment at work, unmanageable workload, lack of role clarity, lack of communication and support from managers, and unreasonable time pressure. Employees who were often treated unfairly were 2.3 times more likely to report a high level of burnout, and employees who were very often or always burned out were 2.6 times as likely to be actively looking for another job (Gallup, 2018).
In consulting, workload and fairness usually arrive together. The same few trusted people get every difficult client, every rescue project and every late proposal. They work more hours, and they can also see that the load is not shared. That combination is a fast route to burnout and resignation.
Long hours also stop paying off. In Pencavel's analysis of British munition workers during World War I, output rose in line with hours up to a threshold of about 49 hours a week and then flattened. Output at 70 hours differed little from output at 56 hours (Pencavel, 2014). That is factory data, not consulting data, but the pattern is familiar. A joint WHO and ILO analysis found that working 55 or more hours a week was associated with a 35% higher risk of stroke and a 17% higher risk of dying from ischemic heart disease, compared with 35 to 40 hours (WHO and ILO, 2021).
Decision implication: treat burnout risk as a workload design problem you can measure, not a resilience problem you leave to each consultant.
Why Average Utilization Hides Overload
A firm-wide utilization number is an average, and averages hide the people at the edges. A team can report a healthy 74% while three people run above 100% for a month and three others are half idle.
Benchmarks make the average look like the whole story. SPI Research reported average billable utilization of 66.4% in 2025 across 509 professional services organizations, the lowest in its survey history (Certinia summary of SPI Research, 2026). The year before it was 68.9%, down from 73.2% in 2021, against what SPI calls an optimal 75% (SPI Research, 2025). A lower average does not mean lower pressure. Demand can be concentrated in fewer skills and fewer people.
Illustrative example: the healthy 74%. A 10-person consulting team shows a 74% average load for the next four weeks, and leadership sees no problem. Per person, the picture is different. Two senior consultants and one data specialist are planned at 105% to 115%. Three junior consultants sit at 40% to 50% because they lack the skills the current projects need. The other four are between 62% and 76%. The average is fine. Three people are heading into a fourth overloaded month.
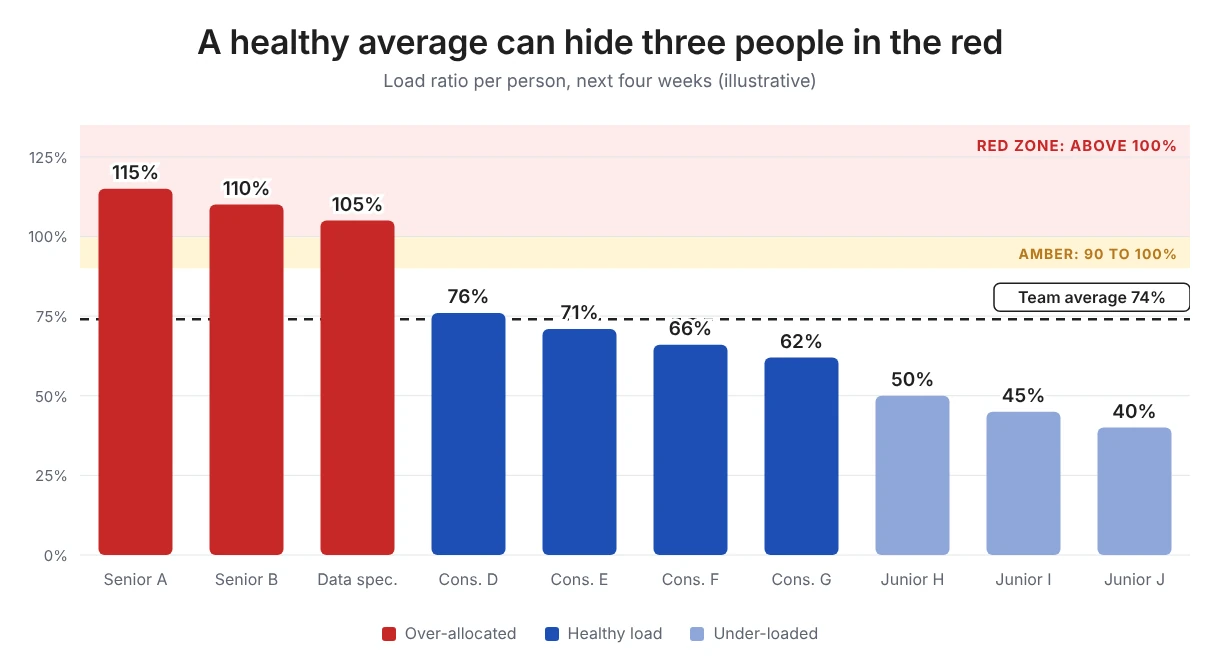
So measure the edges, not only the middle. Two numbers do most of the work: the share of people above 100% load, and how many weeks in a row each of them has been there. A third number exposes hero culture.
Overload concentration = red person-weeks held by the three most loaded people / all red person-weeks x 100
If overload concentration stays above 50%, the main problem is not total demand. It is how work gets assigned.
Decision implication: report load per person and per role next to the firm average, and review the red tail every week.
How to Calculate a Sustainable Workload
Four calculations show whether a person's week is realistic before it starts. All numbers below are illustrative.
Step 1: Calculate Available Hours
Available hours = contracted hours - public holidays - planned leave
Use real calendars. A consultant on a 40-hour contract with a public holiday this week has 32 available hours, not 40.
Step 2: Calculate the Load Ratio
Load ratio = all allocated hours (billable + planned internal work) / available hours x 100
Count everything you planned: client work, sales support, mentoring, internal projects and recurring meetings. Plan to a maximum of about 90%. The last 10% absorbs work that never gets planned, such as client emails, quick reviews and handovers.
Step 3: Adjust Billable Targets for Leave
Many firms set an annual billable target against 2,080 hours (40 x 52) and then count holidays and leave against the consultant. That quietly raises the target in every week the person actually works.
Required active-week utilization = annual billable hour target / (gross hours - public holidays - planned leave) x 100
Example: an 80% target on 2,080 hours means 1,664 billable hours. With 10 public holidays and 15 days of leave (200 hours), 1,880 hours remain, and 1,664 / 1,880 = 88.5%. The firm thinks it asks for 80%, but it asks for 88.5% in every working week, and gives people a reason not to take leave. Measure utilization against available hours instead, as our guide to billable utilization explains.
Step 4: Subtract Switching Time
Consultants on several projects lose time every time they change context. Leroy found that people who move on from an unfinished task perform worse on the next one, because part of their attention stays on the first task (Leroy, 2009). Mark and colleagues found that interrupted people finished tasks faster but reported significantly more stress, frustration and time pressure (Mark, Gudith and Klocke, 2008). There is no reliable universal minutes-per-switch figure, so use your own estimate.
Effective delivery hours = scheduled billable hours - (project switches per week x minutes per switch / 60)
The schedule says 80% in both cases, but the consultant on three projects has five fewer hours to deliver the same plan. SPI's 2026 benchmark points the same way. Consultants in high-performance organizations ran 3.28 concurrent projects on average, against 4.15 at other firms, and logged 137 more billable and 143 fewer non-billable hours a year (Rocketlane summary of SPI Research, 2026). That is a correlation, not proof of cause, but it is a good reason to track concurrent projects next to utilization. For staffing tactics, see our guide to multi-project staffing.
Decision implication: check load ratio, leave-adjusted targets and concurrent projects together. Any one of them can look fine while the person is overloaded.
Set Load Limits by Role, Not One Firm-Wide Target
Billable targets should fall as seniority rises, because senior people carry work that is necessary but not billable: selling, scoping, reviewing, hiring and mentoring. One firm-wide target either pushes seniors into evening work or leaves their non-billable duties to nobody.
There is no current, published benchmark of sustainable utilization by consulting role. SPI describes 75% as optimal at firm level, and Kantata's August 2026 utilization guide says attrition risk starts to climb when utilization stays above 80% (Kantata, 2026). Neither gives a role-level table. The bands below are Operating's planning starting points. Calibrate them against your own margins, pricing and attrition data.
Two rules matter more than the exact numbers. First, billable target and load ratio are different limits. A manager at 55% billable can still be at 105% load once sales and staffing work is in the plan. Second, put non-billable work into the plan as named allocations. Work that is not planned still happens. It just happens at night.
Decision implication: publish one billable band per role and one load ceiling of 90% for everyone.
Early Warning Signals of Overload
Overload shows up in your data before it shows up in a resignation. Look for patterns that last three weeks or more. Every firm has crunch weeks before a milestone. The risk is a crunch that never ends.
These thresholds are starting points. Tune them to your contracts and culture, and do not turn them into surveillance. Hours data cannot tell you how someone feels. A consultant at 85% load on a draining client can be closer to burnout than a colleague at 100% on work they enjoy. Pair the numbers with one regular question in every one-to-one: "Is your next month realistic?" Our guide to planned vs. actual hours shows how to set up the comparison behind the third signal.
See workload by person, not just by firm. Book a 30-minute walkthrough of allocations, capacity and time balance with Lauri, our CEO. Book an intro
A Weekly Workload Rebalancing Review
A 30-minute weekly review is enough for most consulting teams if the data is current before it starts. The resource or operations manager runs it, with practice and delivery leads. The aim is decisions, not a status tour.
Bring three inputs: a four to six week forward view of load per person, a planned vs. actual report for active projects, and a list of deals likely to close in the next two weeks.
Keep three booking levels apart. Forecast demand uses roles, not names, for deals still in the pipeline. Tentative bookings name people for likely work but can still move. Confirmed bookings are locked once the contract is signed. Mixing them is how a consultant ends up at 140% when two tentative deals land in the same week. Our guide to weekly resource management meetings covers the meeting format.
Decision implication: no red name leaves the meeting without an owner and a date.
What to Do When Someone Is Over-Allocated
When a person stays in the red zone, work through four steps in order. Only the last one involves the client.
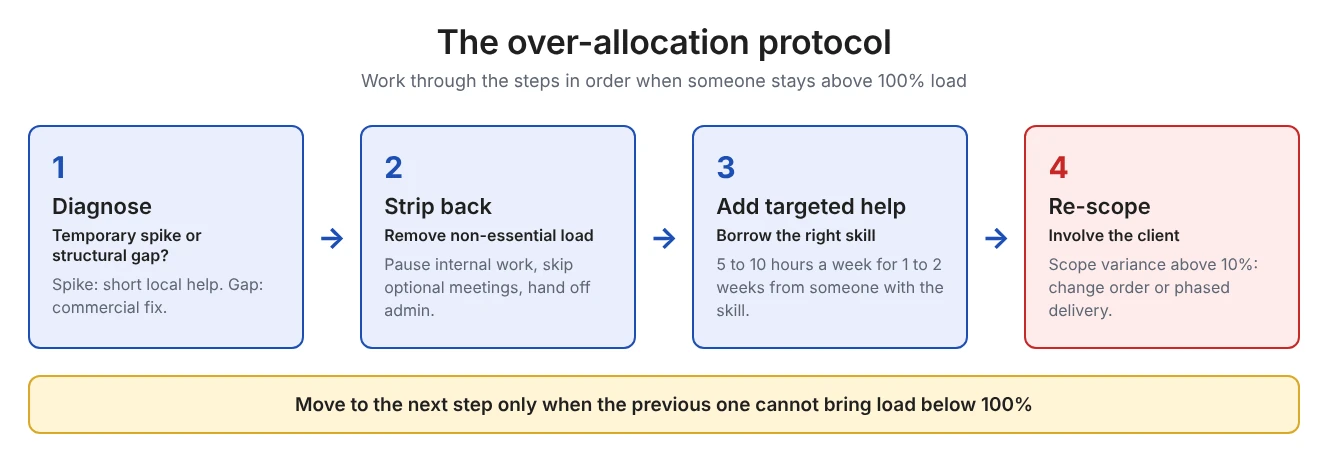
First, diagnose the cause. A temporary spike, such as three heavy days before a board presentation, needs short, local help. A structural gap, such as a scope that was underestimated by 40%, needs a commercial fix. Treating a structural gap with overtime only delays the problem.
Second, strip back non-essential load. Pause internal projects, skip optional meetings and hand admin, formatting and research tasks to someone with spare capacity.
Third, add targeted help. Find a colleague with the specific skill and a few free hours, often 5 to 10 hours a week for one or two weeks, and give them a clearly defined piece of the work. Without skills data, managers fall back on the same few people, which is how heroes are made. See our guide to skills-based staffing.
Fourth, re-scope with the client. If internal moves cannot bring the person back below 100%, the delivery lead should propose a change before the deadline is at risk. That can be a change order for the added work, or a phased delivery where critical items keep their date and secondary items move.
Use a simple variance rule to decide when the fourth step starts.
Scope variance = (actual hours + forecast hours to complete - baseline hours) / baseline hours x 100
Illustrative example: the reasonable requests. A consultant on a fixed-fee strategy project accepts a series of small client requests. Each one takes an hour or two and seems fair. After eight weeks, actual plus remaining hours are 30% over baseline. Nobody opened a change request, so the extra work never appeared in the plan, and the consultant's overtime balance shows +40 hours. A 10% trigger would have started the client conversation in week three.
Decision implication: agree the variance zones with sales and finance in advance, so the red-zone conversation with a client is routine, not personal.
Fix the Upstream Causes: Sales Handover and Hero Culture
Most overload starts before the project does. Two upstream fixes address it.
The first is a delivery check before signature. Before a deal reaches its final stage, delivery confirms that people with the required skills have capacity in the start window, and that the timeline matches past projects of similar scope. If not, the deal changes: a later start, a higher price that covers contractor support, or a smaller first phase. See how to check whether you can staff a deal, and at what margin, and our guide to the handover from sales to delivery.
The second is ending hero culture. Heroes are people whose extra hours hide broken estimates and missing skills, so leadership never gets the signal that the team is understaffed. Track overload concentration, give each hero a backup on their key client, and change what you reward. Reward estimation accuracy, delegation and stable plans, not the highest number of hours logged.
Decision implication: give delivery a real say in pipeline decisions, and treat repeated heroics as a staffing defect to fix.
Spreadsheet or Software for Workload Management?
A spreadsheet works when one person can keep allocations, leave and tracked hours current. It breaks when several managers plan the same people, or when nobody joins timesheets to the plan, so overtime stays invisible. Our guide to resource planning software vs. spreadsheets covers the switch.
Where Operating fits. Operating (operating.app) is resource planning and PSA software for consulting and professional services firms. As of October 2026, it shows confirmed allocations, tentative work, internal work and time off on one timeline, with availability filters that show how free each person is (Operating: resource management). Capacity can be compared with committed and tentative work by role, skill or team (Operating: capacity planning). Time Balance calculates each person's surplus or deficit hours from timesheets against their contracted hours, which makes a growing overtime balance visible (Operating: Time Balance). One honest limit: Operating measures hours, allocations and plans. It cannot measure stress or motivation, and the thresholds in this guide are decisions your leadership team still has to make.
Your next step: pull the last eight weeks of planned and tracked hours per person, calculate each person's load ratio, and count how many red person-weeks your three most loaded people hold. That number shows whether you have a demand problem or an assignment problem.
Want to see your team's workload in one view? Book a 30-minute walkthrough with Lauri, our CEO, using your own people and projects. Book an intro
FAQ
What is workload management?
Workload management is the practice of matching planned work to each person's available hours, skills and role so nobody runs above capacity for long. In consulting it works week by week, for named people, two to six weeks ahead. Capacity planning looks months ahead at roles, and resource allocation decides who works on which project.
How do you balance workload across a consulting team?
Measure load per person: all allocated hours divided by available hours. Plan to about 90% and treat anything above 100% as red. Review red names every week, move work to people with the right skills and spare hours, and re-scope with the client when internal moves are not enough. Then fix the sales handover and hero culture upstream.
What utilization rate leads to burnout?
No research gives a universal cutoff. Burnout depends on hours, fairness, control and how long overload lasts. SPI Research describes 75% billable utilization as optimal at firm level, and Kantata says attrition risk climbs when utilization stays above 80%. More important: nobody should be planned above 100% of available hours for three weeks in a row.
What is a good billable utilization target for consultants?
It depends on role. As planning starting points, junior consultants can usually sustain 75% to 85%, consultants 70% to 80%, senior specialists 60% to 75%, managers 45% to 65% and partners 25% to 50%. These are not benchmarks. For context, SPI Research reported a 66.4% industry average in 2025 across 509 professional services organizations.
How do you calculate workload capacity for one person?
Subtract public holidays and planned leave from contracted hours to get available hours. Add up all allocated work, billable and internal, and divide it by available hours to get the load ratio. For consultants on several projects, also subtract an estimate of switching time to see their effective delivery hours.
What are the signs that a consultant is overloaded?
Common signs are a load ratio above 100% for three weeks in a row, a growing overtime balance, actual hours running ahead of plan, four or more parallel projects, no leave booked in 90 days and regular weekend time entries. Confirm the pattern in a one-to-one, because hours data cannot show how someone feels.
How should holidays and leave affect utilization targets?
Measure utilization against available hours, after holidays and leave, not against 2,080 hours a year. If leave counts against the consultant, an 80% annual target becomes 88.5% in the weeks they actually work, assuming 25 days of holidays and leave. That hidden pressure also discourages people from taking time off.
How many projects should a consultant work on at once?
There is no fixed rule, but fewer is usually better. SPI Research's 2026 benchmark found that consultants at high-performance firms averaged 3.28 concurrent projects, against 4.15 elsewhere. Treat four or more active projects as a reason to review someone's week.
How often should you rebalance team workloads?
Weekly. A 30-minute review of red names, project variance and new work is enough for most consulting teams. Update leave, allocations and pipeline before the meeting so the time goes into decisions. Review role targets and warning thresholds once a quarter, or sooner after a big change in demand.
Can you manage team workload in a spreadsheet?
Yes, when one person can keep allocations, leave and tracked hours current. Spreadsheets struggle when several managers plan the same people, when tentative and confirmed work must stay separate, or when tracked time is not joined to the plan. Then overload stays invisible until someone resigns.
Methodology
We reviewed public research on burnout and working hours (WHO, Gallup, Maslach and Leiter, Pencavel, and the joint WHO and ILO analysis), research on task switching and interruptions (Leroy; Mark, Gudith and Klocke), professional services benchmarks from SPI Research as published or summarized by Certinia, Rocketlane and Kantata, and Operating's product pages and documentation. Sources were checked on October 2, 2026. Where the full SPI report was not publicly accessible, we used vendor summaries and say so in the citation.
The load ratio zones, role bands, warning thresholds and scope variance zones are Operating planning frameworks, not research findings. The scenarios and worked calculations are illustrative. They show common patterns in consulting firms and do not describe Operating customers.
Sources
Burnout and working hours
- WHO: Burn-out an "occupational phenomenon": International Classification of Diseases (2019)
- Gallup: Employee Burnout, Part 1: The 5 Main Causes (2018)
- Maslach and Leiter: Understanding the burnout experience, World Psychiatry (2016)
- Pencavel: The Productivity of Working Hours, IZA Discussion Paper 8129 (2014)
- WHO and ILO: Long working hours increasing deaths from heart disease and stroke (2021)
Task switching and interruptions
- Leroy: Why is it so hard to do my work? The challenge of attention residue when switching between work tasks, Organizational Behavior and Human Decision Processes (2009)
- Mark, Gudith and Klocke: The Cost of Interrupted Work: More Speed and Stress, CHI (2008)
Professional services benchmarks
- Certinia: Analyzing the 2026 SPI Research Professional Services Maturity Benchmark Report
- Rocketlane: 2026 Professional Services Maturity Benchmark
- SPI Research: 2025 Professional Services Maturity Benchmark (copy hosted by Kantata)
- Kantata: Professional services utilization benchmarks (2026)
Operating sources
- Operating: Resource management
- Operating: Capacity planning
- Operating: Introducing Time Balance tracking
Written by Lauri Eurén, CEO of Operating. Last updated October 2, 2026.