


Project forecasting from live actuals
Where will this project land? Operating projects revenue, costs, hours, and margin from what has actually happened — actuals up to your cutoff date, forecast from there. The answer stays current, not last month's guess.
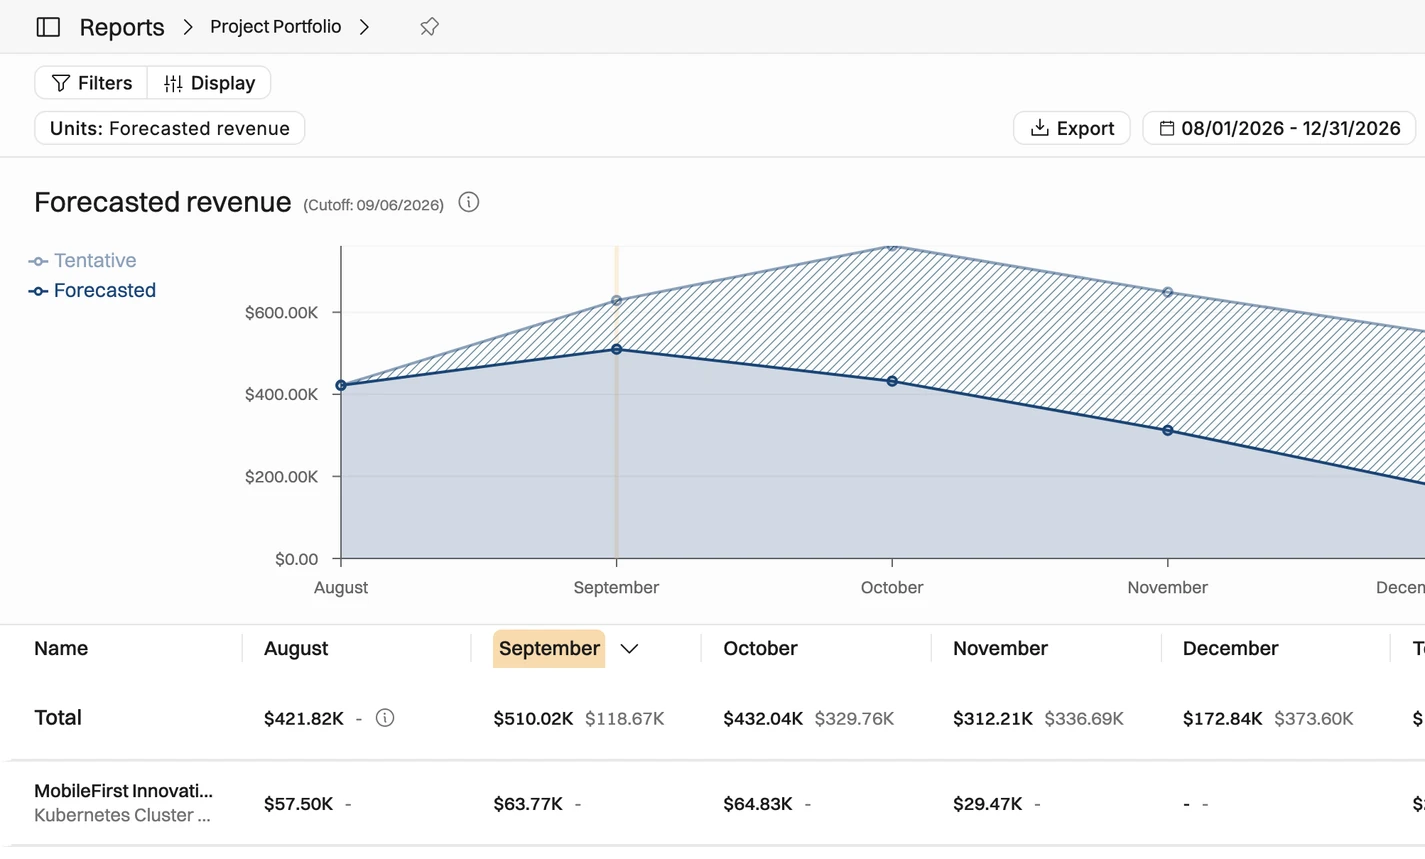

Actuals to the cutoff
Pick a cutoff date: everything before it is booked actuals, everything after runs on the plan — no double counting.

See overruns coming
Labor and expenses projected together on the burn-up graph, showing budget excess on capped time-and-materials and fixed price before you've eaten it.

The number leadership asks for
Drill into any project's forecast by phase or per person, and answer "where will we land?" in seconds.
Actuals to the cutoff, forecast from there
Live data always lags. Timesheets arrive late, expenses trickle in, and "today" is never fully booked — so a forecast built on this week's numbers quietly understates the truth. Operating fixes this with a cutoff date: pick the last closed period, and everything before it is booked actuals, everything after runs on the plan. No gaps, no double counting.
Cutoff date splits booked actuals from forecast — you choose where
Revenue recognition directly affects future forecast
Half-logged weeks never pollute the projection
Revenue, costs, hours remaining, and margin at completion
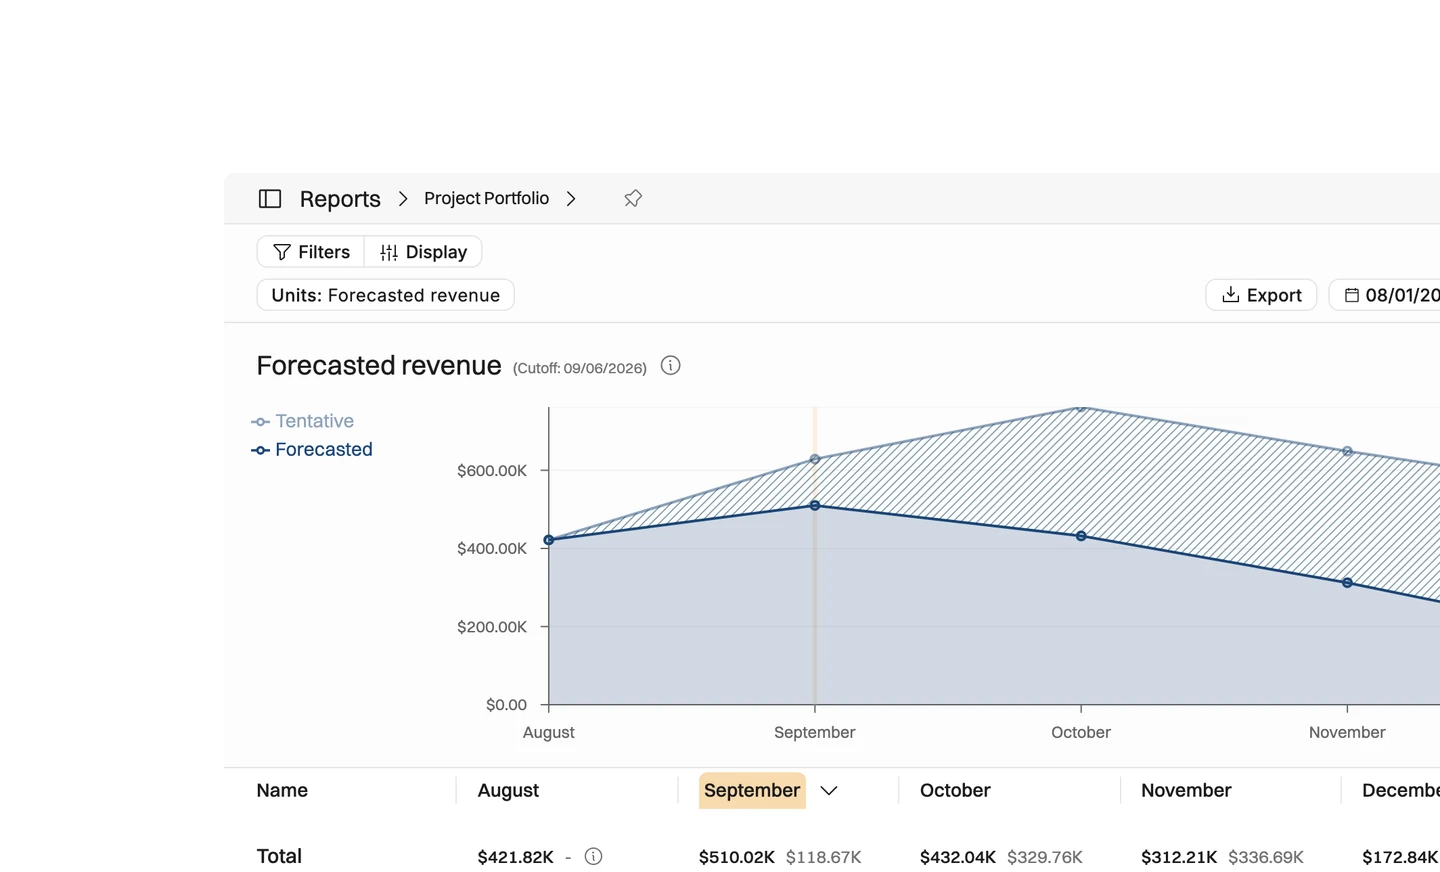





Spot project budget overruns
A forecast that only tracks hours misses where projects start losing money. Operating projects labor and expenses together onto the project's burn-up graph.
Support for fixed price projects, time & materials work and projects with a capped T&M budget
Burn-up graph shows plan, actuals, and forecast in one curve
Expenses forecast alongside labor — the whole cost picture
Budget excess forecast on capped time-and-materials and fixed price
Revenue recognition defines earned revenue in fixed price project
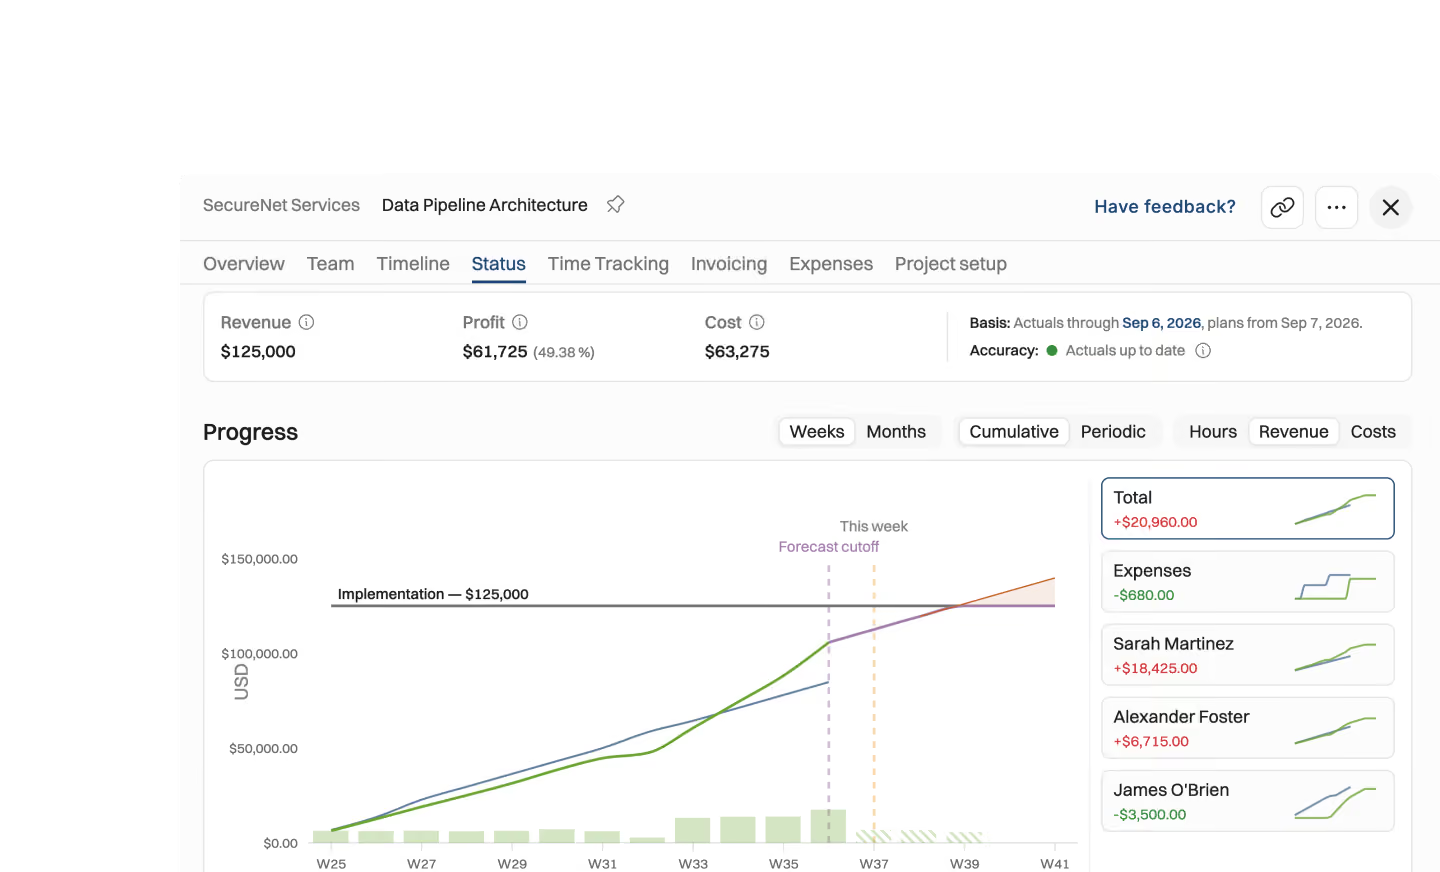
The numbers leadership asks for
"Where will we land?" is a CEO question, and it deserves better than a shrug and a spreadsheet. Drill into any project's forecast by phase, toggle it per person, and give a current answer in seconds, instead of spending a week rebuilding the numbers by hand.
Get the forecasted profit based on where you're currently at in the project
Forecast per phase, or per person to know what drives revenue
Toggle per person to see who drives hours and cost
Current enough to answer the Monday-morning question
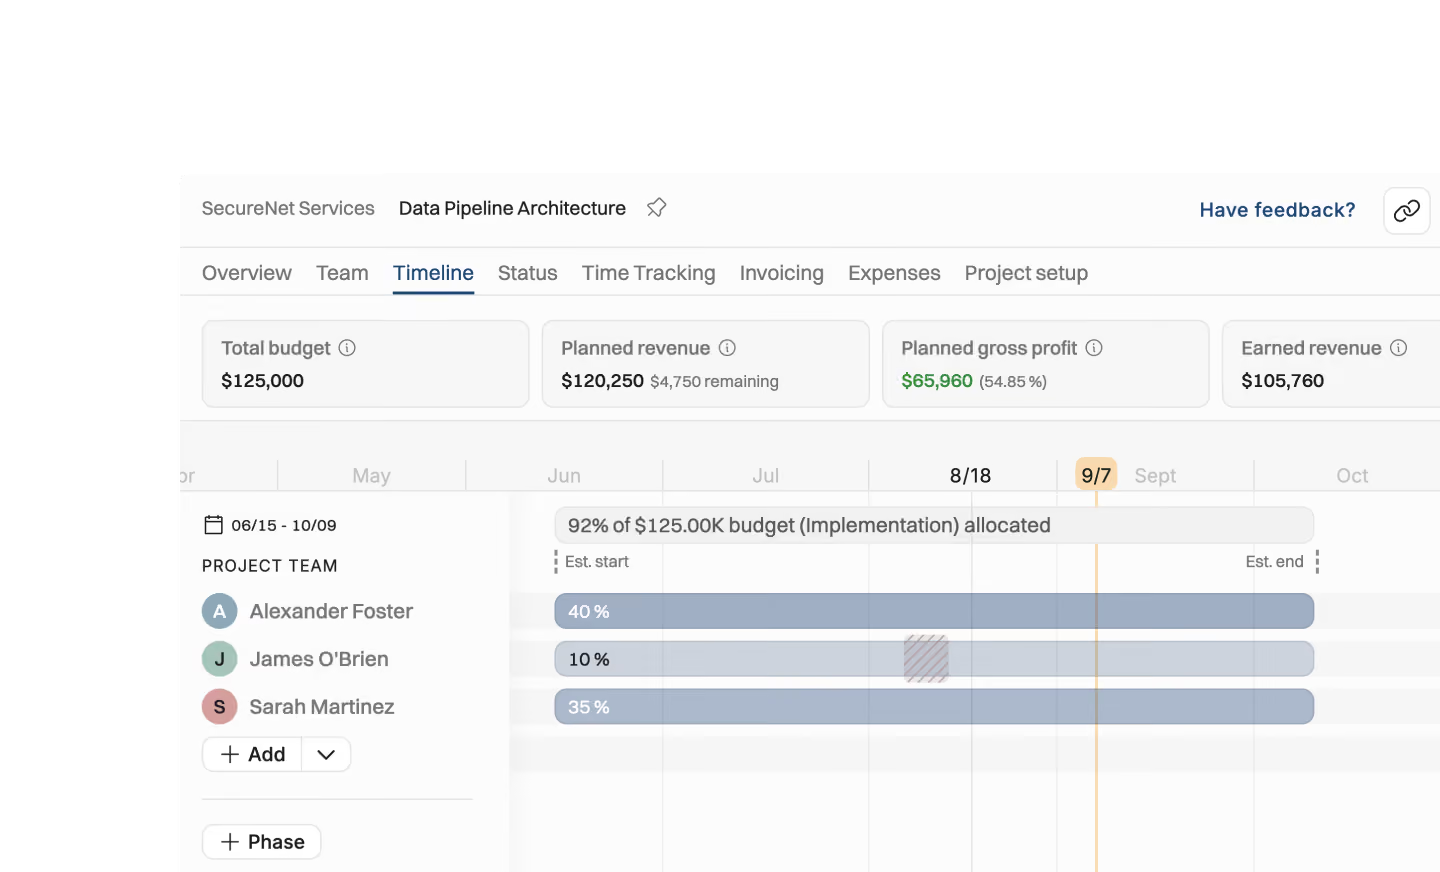
Why does a forecast need a cutoff date?
Live data always lags, so a forecast built on it understates the truth.

Timesheets arrive late, expenses trickle in, and today is never fully booked. A projection built on this week's numbers quietly reports less work and less cost than really happened, and the gap gets worse the closer you look at the present.
So we split the timeline. You pick the last closed period, and everything before it is booked actuals, while everything after it runs on the plan.
That one choice removes both failure modes at once: no gaps where half-logged weeks drag the numbers down, and no double counting where actuals and plan overlap. Revenue, costs, hours remaining, and margin at completion all rest on the same clean split.
It also lets the forecast cover where projects actually bleed. Labor and expenses are projected together onto the burn-up graph, and on capped time-and-materials or fixed price work the budget excess shows up before you've eaten it. Drill in by phase or per person, and "where will we land?" has a current answer.


Get the Operating Routine for resource planning
A weekly routine for staffing and capacity, written by people who ran it in their own firms. It gives your resource planning meeting a fixed agenda and a short list of numbers to check. Get the guide.
Thank you!
Get the Staffing Routine by clicking below.
Download guide
