


Capacity planning for the work ahead
Know whether you have the people for what's coming — before you commit. Operating shows supply against demand by role and skill across the coming months, so you can hire, subcontract, or take on work with evidence.
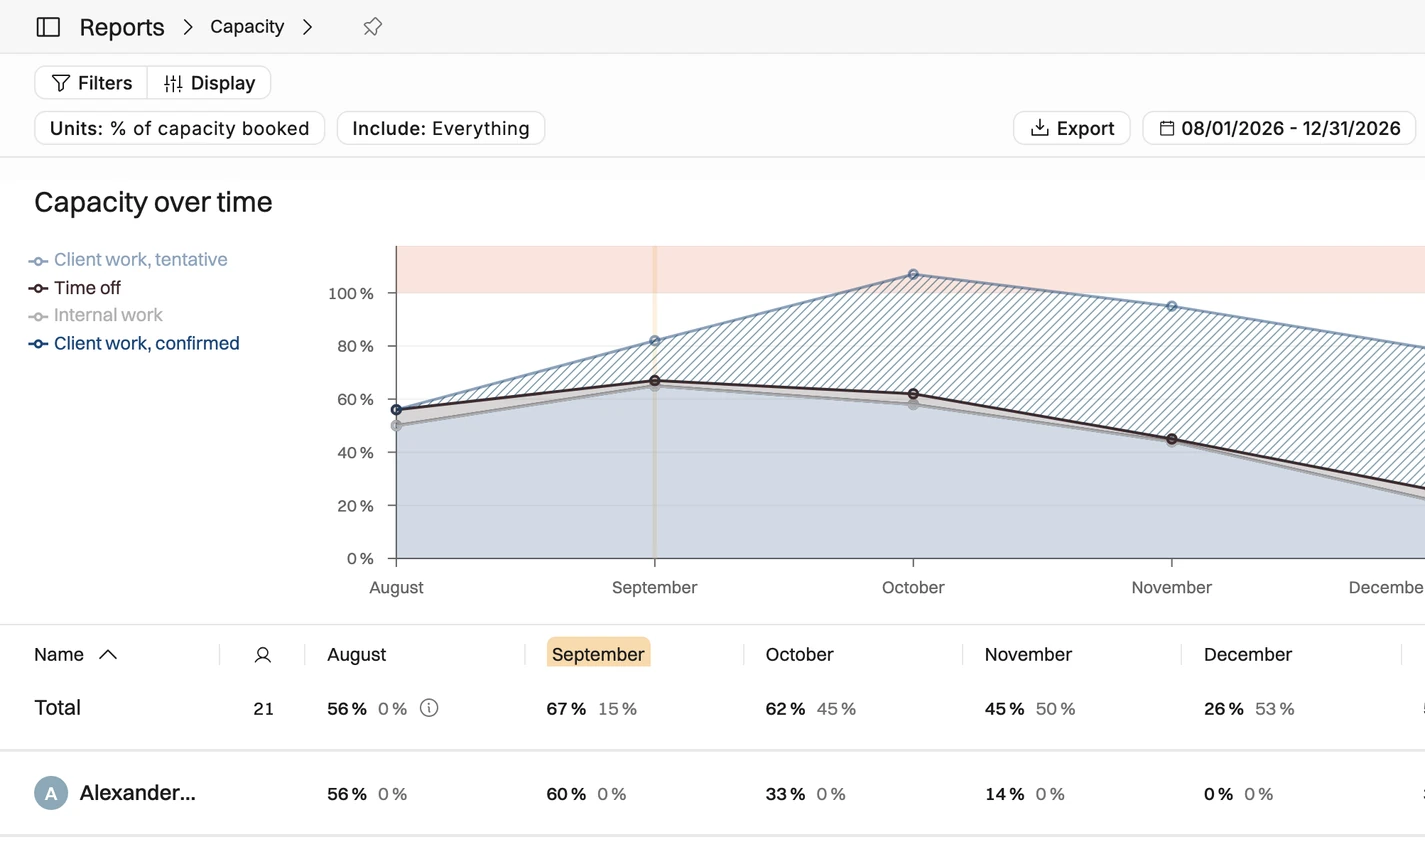

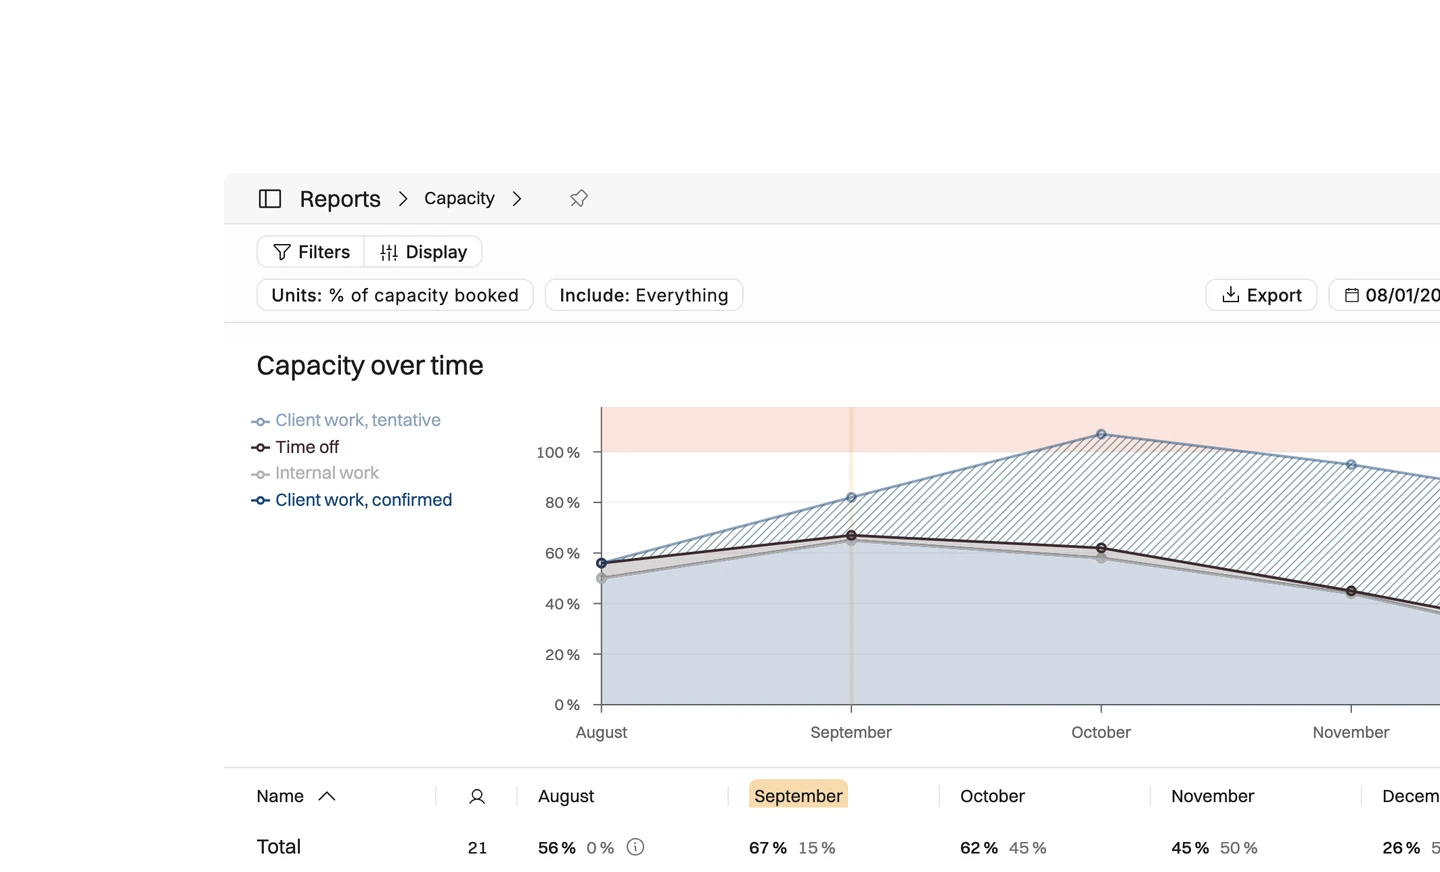
Supply vs demand, months ahead
Set committed and tentative work against the hours your team actually has — by role, skill, or team.

Know when to hire
Test what winning a deal does to capacity, then back hiring and subcontracting calls with numbers instead of gut feel.

Capacity, connected to financials
Tie capacity to your financials and utilization, effective hourly rate, and margin follow — on time-and-materials and fixed-price work alike.
Supply and demand
Add up committed and tentative work, and set it against the hours your team actually has by role, skill, or team. Know exactly when your team is overbooked and underutilized.
Demand from committed and tentative projects in one view
Supply by role, skill, site, or team
Gaps and crunch points visible months out
See capacity booked, available, or look into absolute hours





Know when to hire
If two of the deals in the pipeline land, do you need to recruit, subcontract, or shift start dates? Run the question against the numbers instead of gut feel, and give sales an honest answer on when the firm can start.
See if you have the needed talent for work in the pipeline
Get the earliest honest start date for new work
Back hiring and subcontracting calls with numbers
.avif)
Capacity, connected to project financials
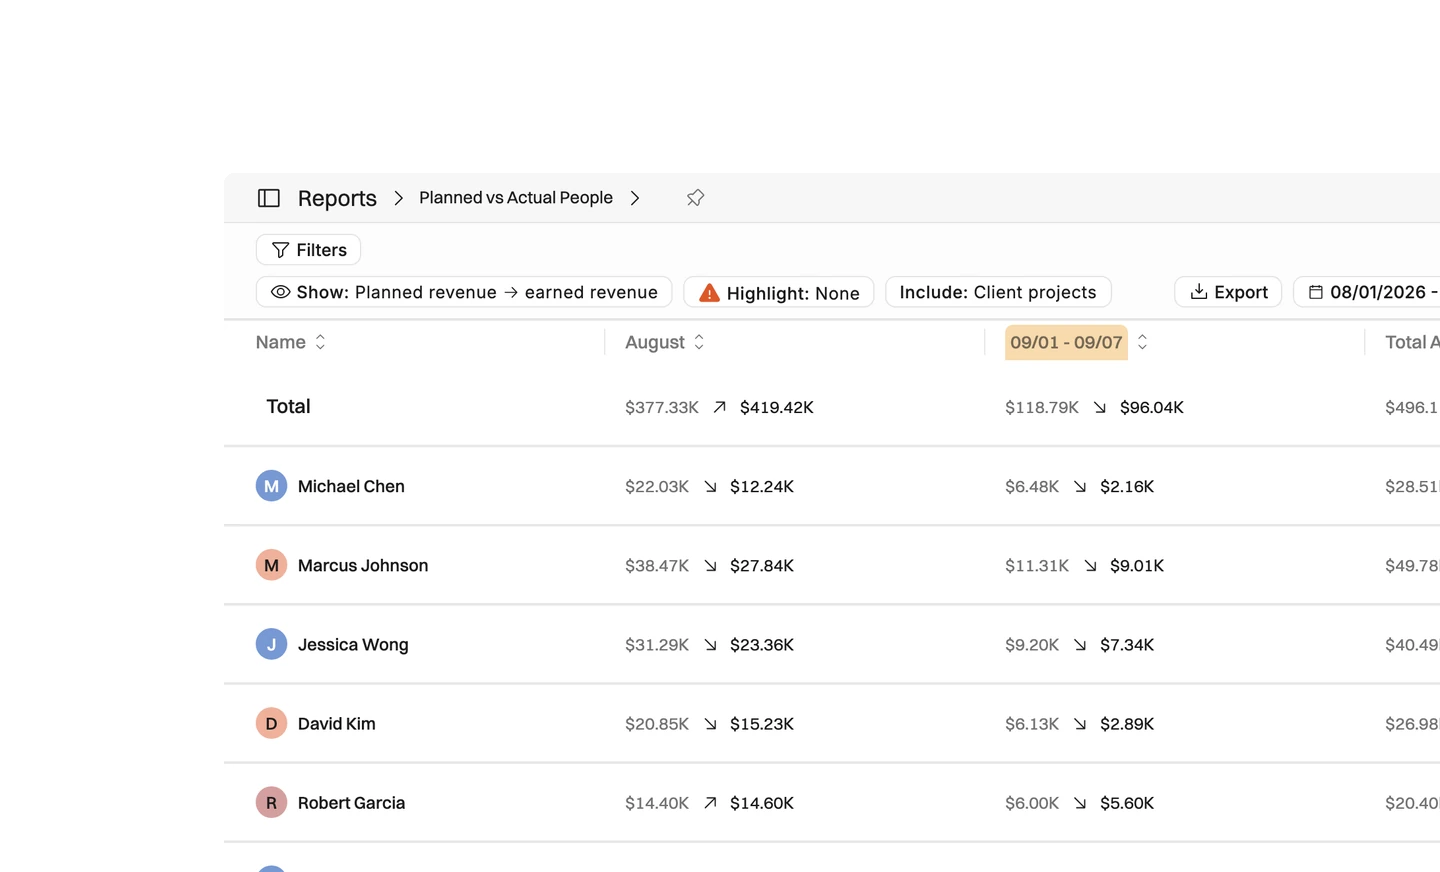
Tie capacity to your financials and the numbers follow: utilization, effective rate per hour, margin. On time-and-materials work, hours drive revenue. On fixed price, they drive cost and margin. Either way, your capacity plan is a financial plan.
Utilization numbers available in real time
Effective hourly rates and margin — fixed-price projects included
See what a headcount change does to the quarter's economics
Why plan capacity months ahead?
Capacity is a supply and demand question, and the answer moves every week.

Committed work, tentative work, and the hours your team actually has all sit in different places. Put them in one view by role, skill, site, or team, and the gaps and crunch points show up months out.
If two of the deals in the pipeline land, do you need to recruit, subcontract, or shift start dates? Guessing is expensive either way.
Run the question against the numbers instead of gut feel. Sales gets an honest answer on when the firm can start, hiring and subcontracting calls get backed by numbers, and nobody commits to work the team has no hours for.
Your capacity plan is also your financial plan: on time-and-materials work, hours turn into revenue; on fixed price, they turn into cost and margin. That's why utilization, effective rate per hour, and margin sit right next to the plan, so a headcount change shows its effect on the quarter.


Get the Operating Routine for resource planning
A weekly routine for staffing and capacity, written by people who ran it in their own firms. It gives your resource planning meeting a fixed agenda and a short list of numbers to check. Get the guide.
Thank you!
Get the Staffing Routine by clicking below.
Download guide
