
TL;DR: Plan capacity by role, skill and week, not only by total hours, because spare hours in the wrong role do not help. Keep committed work separate from pipeline, and weight pipeline with probabilities calibrated against your own win history. Use several time horizons: near-term plans drive allocation, while 12 to 16 week plans drive hiring and contractor decisions. Plan hiring on time-to-useful-capacity, not time-to-fill, because notice periods, access and ramp-up add weeks. Finally, put a price on shortages. Contractor premiums, overtime and lost contribution margin make capacity a financial decision.
Short answer: Agency capacity planning is the process of comparing the people, skills, and usable hours your firm will have against the work you have committed and the work you are likely to win. A good plan does not stop at total headcount: it forecasts by role and time window, weights tentative pipeline using realistic probabilities, accounts for hiring and onboarding lag, and turns future gaps into decisions before delivery or margin is at risk.
The same model works for digital agencies, consultancies, IT services firms and other professional services firms. What they sell is people's time, and that time is not interchangeable. This guide shows how to build the model, step by step, so you can use it in a spreadsheet tomorrow.
Written by Lauri Eurén, CEO of Operating. Last updated September 26, 2026. The five scenarios in this guide (Ghost Capacity, the 70% deal, Day 40, the Shrinking Horizon and the cost of a shortage) are illustrative examples, not customer data.
Agency capacity planning at a glance
| Question | What to measure | Decision it drives |
|---|---|---|
| How many hours can we deliver? | Usable supply: calendar hours minus holidays, leave and internal commitments | Realistic targets and commitments |
| Can the right people do the work? | Supply by role, skill and seniority in each week | Accept, reschedule or subcontract work |
| What work is coming? | Committed demand plus calibrated, probability-weighted pipeline | Early staffing and bench plans |
| Can we add capacity in time? | Time-to-useful-capacity for hires and contractors | When to open a requisition |
| What does a gap cost? | Contractor premium, overtime, delay costs, lost contribution margin | The cheapest acceptable response |
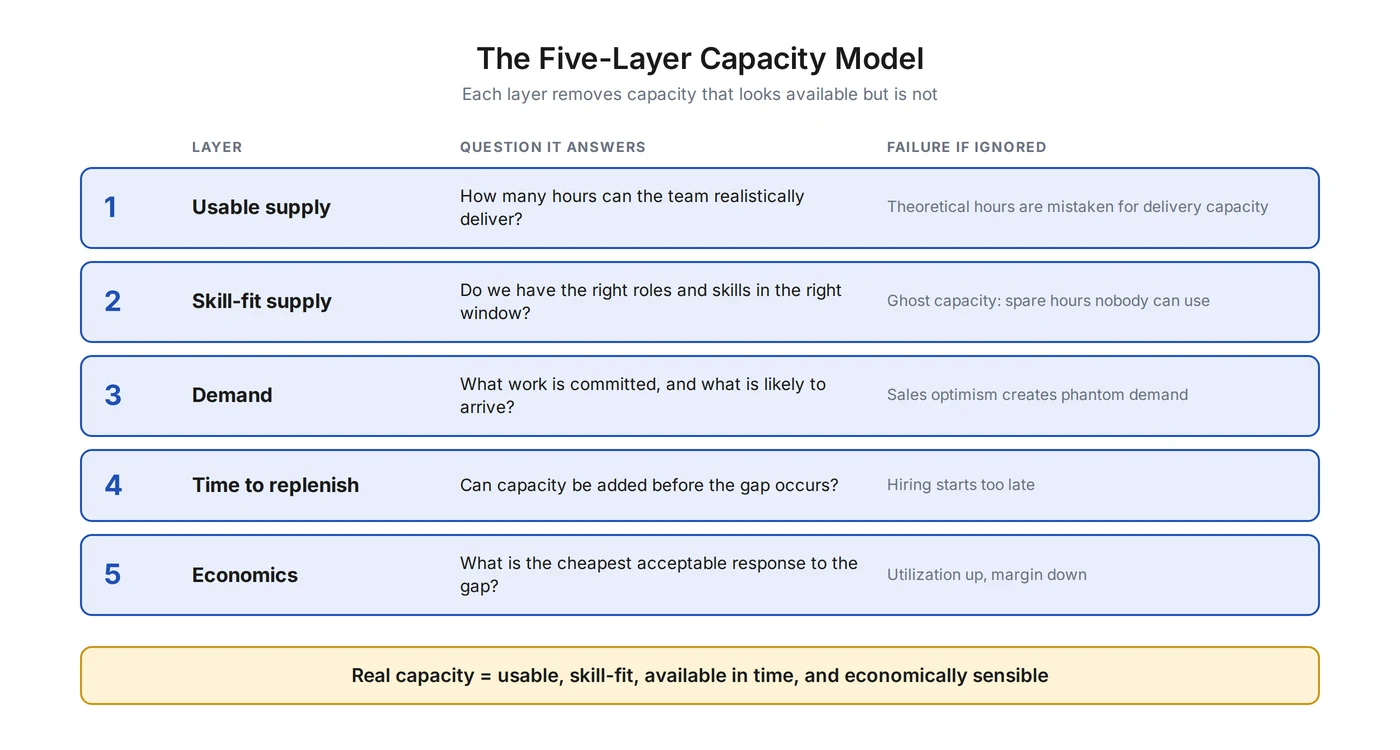
What Is Agency Capacity Planning?
Agency capacity planning is the practice of forecasting whether your team will have enough of the right skills, in the right weeks, to deliver the work you have sold and the work you expect to sell. It ends in decisions: accept work, move a start date, bring in a contractor, or hire.
A capacity plan has four parts. Supply is the usable hours of each person, by role, skill and seniority. Demand is signed projects, renewals, change requests and likely pipeline deals, converted into hours by role. The time horizon is the weeks or months you plan across, from next week to next year. The decision output is the actions you take when supply and demand do not match.
Capacity planning is not scheduling and it is not project management. Scheduling decides which tasks happen on which day. Project management runs the delivery of one project. Capacity planning looks across all projects and asks whether the firm as a whole can take on and deliver the work.
In professional services, your inventory is people-hours. Unlike stock in a warehouse, those hours expire every week and they are not interchangeable: an hour from a junior designer cannot replace an hour from a lead cloud architect. The simplest form of the model is one equation:
Net capacity = usable supply - expected demand
A positive result means spare capacity. A negative result means a gap you need to close. The rest of this guide explains how to calculate each side properly, and why you should run the equation for each role, not only for the whole company.
Capacity Planning vs. Resource Planning
Capacity planning asks: "Do we have enough of the right capacity for the work ahead?" It works at the level of roles, skills and weeks. Resource planning asks: "Who specifically works on what, and when?" It works at the level of named people and project assignments. You need both. Capacity planning tells you whether you can say yes to new work and when to hire. Resource planning makes sure the work gets done by the right people. Capacity planning usually looks further ahead; resource planning usually covers the next few weeks. For a full comparison, read our guide to the difference between capacity planning and resource planning. For the wider family of capacity planning types, see types of capacity planning.
Why a Single Capacity Utilization Number Can Lie
A company-wide utilization number can look healthy while the one role you need is fully booked. Total hours hide skill bottlenecks. That is why you should forecast bottlenecks by role, skill and time window.
Illustrative example: the Ghost Capacity mirage. A VP of Delivery sees 68% utilization for the coming weeks and more than 400 free hours across the firm. Then sales signs a $1.2M cloud migration that starts next Monday. The biggest blocks of free time belong to three junior frontend developers (120 hours), two QA automation engineers (80 hours), an agile coach (40 hours) and a mid-level Java developer (40 hours). But the project needs a Lead AWS Data Architect with Terraform skills before anyone else can start. The firm has three. One is allocated at 110% on a troubled banking project. One starts planned parental leave on Friday. One is the only person on a compliance project with penalty clauses. The dashboard says "32% spare capacity". The real usable capacity for the critical role is zero. The firm pays an outside contractor $220 per hour and the project margin shrinks before kickoff.
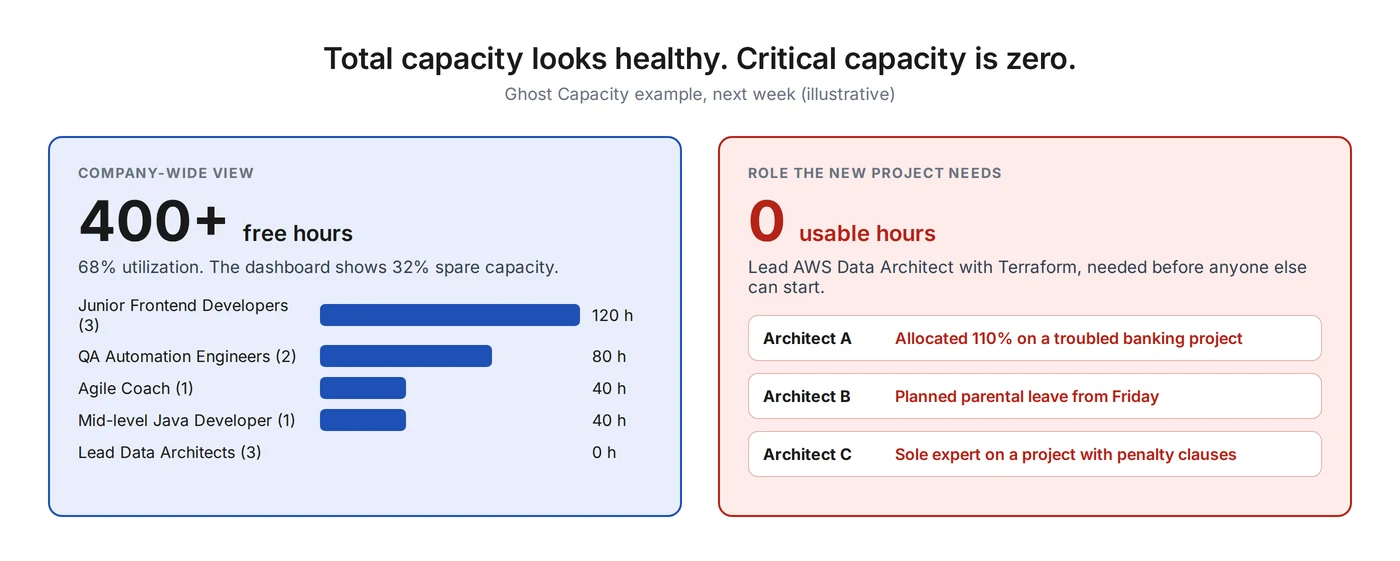
There are three levels of capacity, and each answers a different question. Aggregate capacity is the total free hours across the firm: useful for budgets, dangerous for accepting work. Role-specific capacity is the free hours of people in one role, such as senior backend developers. Skill-specific capacity is the free hours of people who meet every requirement of the work, such as AWS plus Terraform plus lead seniority.
Many constraints can make "free" hours unusable: seniority, certifications, language, geography and time zone, security clearance, client continuity (the client wants the same team), and contractual commitments to other clients. None of these show up in a single utilization percentage.
Decision implication: before you accept work, check capacity for the constraining role and skill in the start window, not the company total.
How to Calculate Agency Capacity
You calculate agency capacity in four steps: gross hours, usable hours, billable target hours and role-specific capacity. Each step removes hours that are not really available for client work. The example below uses a team of 10 full-time people over one month with 21 working days. All numbers are illustrative.
Step 1: Calculate Gross Working Capacity
Gross capacity = FTE count x working days in the period x paid hours per day
For our team: 10 FTE x 21 days x 8 hours = 1,680 hours. FTE means full-time equivalent. A person who works three days a week counts as 0.6 FTE. For contractors, add their contracted hours directly instead of converting them to FTE. Use a weekly or monthly period, whichever matches your planning cadence.
Step 2: Convert Gross Hours Into Usable Capacity
Usable capacity = gross capacity - holidays - PTO - known leave - internal commitments - non-delivery reserve
Available hours should reflect real working time, not 40 hours x 52 weeks. In our example, one public holiday removes 80 hours and planned PTO removes 96 hours, which leaves 1,504 available hours. Internal commitments (leadership, sales support, training, recruiting interviews) remove another 180 hours. A small non-delivery reserve for admin and context switching removes 75 hours. Usable delivery capacity is 1,249 hours.
Roles are structurally different. A practice lead may spend 40% of their time on sales and people management. A junior developer may spend 5%. Record internal commitments per person or per role, not as one company-wide percentage.
Step 3: Calculate Billable Capacity
Target billable capacity = available working hours x target billable utilization
Do not subtract the same non-billable time twice. Most firms measure utilization against available hours (after holidays and leave). If you do, apply the target to available hours, and use usable capacity from Step 2 as a ceiling check. In our example, a 75% target gives 1,504 x 0.75 = 1,128 target billable hours. That is below the 1,249 usable hours, so the target is realistic and leaves some room for non-billable delivery work. If the target were above usable capacity, the target would be impossible without cutting internal commitments.
Utilization targets are business assumptions, not universal laws. Derive them from your cost base, role design, pricing model and margin goals. Benchmarks give context only: SPI Research's 2026 Professional Services Maturity Benchmark reported average billable utilization of 66.4% in 2025, based on 509 professional services organizations, the lowest in SPI's survey history (as summarized by Certinia). For the formula and a deeper discussion, see our guide to billable utilization.
Worked capacity calculation (illustrative, 10 FTE, one month)
| Line | Hours | How it is calculated |
|---|---|---|
| Gross capacity | 1,680 | 10 FTE x 21 days x 8 hours |
| Public holidays | -80 | 1 day x 10 people x 8 hours |
| PTO and known leave | -96 | 12 planned leave days |
| Available hours | 1,504 | Denominator for utilization |
| Internal commitments | -180 | Leadership, sales support, training |
| Non-delivery reserve | -75 | About 5% of available hours |
| Usable delivery capacity | 1,249 | Ceiling for delivery work |
| Target billable capacity | 1,128 | 1,504 x 75% target (must stay below 1,249) |
Step 4: Calculate Capacity by Role and Skill
Role-specific capacity = sum of usable hours for people who meet the required role, skill and seniority constraints in the planning window
This step turns one number into a matrix. For each role or skill that can block delivery, compare available hours with committed hours and tentative demand in the same window. The Ghost Capacity example above looks like this for the next four weeks:
Role and skill matrix, next 4 weeks (illustrative)
| Role | Required skill | Usable hours | Committed hours | Tentative demand | Net gap |
|---|---|---|---|---|---|
| Lead Data Architect | AWS, Terraform | 320 | 336 | 120 | -136 |
| Junior Frontend Developer | React | 480 | 360 | 40 | +80 |
| QA Automation Engineer | Playwright | 320 | 240 | 40 | +40 |
| Mid-level Java Developer | Spring | 160 | 120 | 80 | -40 |
| Agile Coach | Scrum | 160 | 120 | 0 | +40 |
The firm has spare hours in total, but two roles are short and one of them blocks the whole project. Use the role view, not the company total, when you accept work. For how to match people to roles once the gap is visible, see our guide to project staffing in professional services.
Decision implication: build your capacity model so you can drill from the company total into each constraining role and skill.
Forecast Demand From Signed Work and Pipeline
Demand has three layers: committed work, probable work and optional upside. You need all three, converted into hours by role and time window. A revenue number is not a staffing plan.
Committed work covers signed projects, retainers, support commitments, contractually confirmed renewals and approved change requests. Probable work covers pipeline deals, likely extensions and scope expansions, weighted by a realistic probability. Optional or upside work covers early-stage opportunities and internal strategic work you would do if capacity allows.
A $500,000 deal is not useful for staffing until it becomes estimated hours by role and month. Ask delivery leads for a simple role mix for each material opportunity: for example, 480 senior developer hours and 160 architect hours starting in November. Include internal strategic work when it is material, such as building a new service line.
Do not reserve people at 100% for every unsigned deal. That creates phantom demand, idle bench time, and lost chances to sell those people to work that is ready to sign.
Calibrate Pipeline Probabilities Instead of Trusting CRM Labels
Weighted pipeline is useful, but only if the weights are true. CRM stage probabilities are often set once and never checked. Calibrate them against what actually closed.
Illustrative example: the 70% deal hallucination. A Practice Director sees a retail transformation deal at "70% probability, verbal agreement". The plan pulls three senior full-stack developers and a DevOps engineer off the bench for next month. She holds back a smaller, ready-to-sign $150,000 refactoring deal to protect them. Four weeks later the developers are still waiting, doing internal work. In week six, the client's CFO freezes all vendor spend and the deal dies. When she audits two years of CRM history, she finds that of 42 deals labeled 70%, only 8 closed: an observed conversion of 19%.
Observed stage conversion = deals that reached the stage and were won / all deals that reached the stage
Use 12 to 24 months of historical data where you have it. If you have enough volume, segment by service line, deal size, customer type or lead source, because one probability can hide big differences. Compare the CRM probability with the observed conversion, and where they differ materially, use the observed rate for capacity forecasting. If your data is too thin for a reliable point estimate, use three scenarios instead: conservative, base and upside.
Pipeline calibration by stage (illustrative)
| CRM stage | CRM probability | Observed conversion (24 months) | Use for capacity |
|---|---|---|---|
| Qualified | 20% | 8% | 8% |
| Proposal sent | 40% | 21% | 21% |
| Verbal agreement | 70% | 19% (8 of 42) | 19% |
| Contract in legal review | 90% | 74% | 74% |
Notice that in this example, "verbal agreement" converts worse than "proposal sent". That happens more often than sales teams expect, and it only becomes visible when you measure it.
Calculate Weighted Demand
Weighted pipeline demand = sum of (estimated delivery hours by role x calibrated win probability)
Weighted demand with calibrated probabilities (illustrative)
| Opportunity | Expected start | Role | Estimated hours | CRM probability | Calibrated probability | Weighted hours |
|---|---|---|---|---|---|---|
| Retail transformation | November | Senior full-stack developer | 480 | 70% | 19% | 91 |
| App refactoring | November | Senior full-stack developer | 240 | 90% | 74% | 178 |
| Cloud migration | December | Lead Data Architect | 160 | 40% | 21% | 34 |
With CRM probabilities, these three deals add 616 weighted hours. With calibrated probabilities, they add 303. The difference is roughly two senior people for a month.
Two rules keep weighted demand honest. First, always attach an expected start date and duration. A probability-weighted total with no time axis is not a capacity plan. Second, remember that expected value is a forecasting tool, not a schedule. A 480-hour deal at 19% will not produce 91 hours of work. It will produce either zero or 480. Use weighted totals to size the bench and hiring plan, and use scenarios (for example, "what if the retail deal closes?") to test whether you can staff the big deals if they land.
Decision implication: replace CRM stage percentages with your own observed conversion rates before you use pipeline to make staffing or hiring decisions.
Plan by Time Horizon, Not One Static Forecast
Use several planning horizons, each tied to a different decision. Certainty drops as you look further ahead, so the plan for next week and the plan for next quarter should not be treated with the same confidence.
Capacity planning horizons and the decisions they drive
| Horizon | Main decisions | Typical data quality |
|---|---|---|
| Current and next 2 weeks | Allocate people, resolve conflicts | High: mostly committed work |
| 4 to 8 weeks | Rebalance teams, move start dates, plan roll-offs | Medium: committed work plus late-stage pipeline |
| 12 to 16 weeks | Hire, bring in contractors, reskill, re-scope | Lower: pipeline-heavy |
| 6 to 12 months | Workforce strategy, role mix, new service lines | Low: scenarios, not point forecasts |
This structure is common in professional services. Accelo describes a similar four-tier model (daily and weekly, 4 to 8 weeks, 12 to 16 weeks, 6 to 12 months), and Teamwork recommends a rolling three-to-six-month window for pipeline-based capacity forecasting. There is no universal horizon. Set yours from your sales cycle length, hiring lead time, notice periods, typical project lead times and how volatile your demand is. If your time-to-useful-capacity for a senior hire is four months, a two-month horizon is too short to act on.
Planning horizons are about capacity, not tasks. Sprint and task-level planning belong in your delivery tools.
Decision implication: map each planning horizon to one decision type and one meeting, so every forecast has a clear use.
Measure Forecast Error by Horizon
A forecast is not simply right or wrong. Measure how its error changes as the start date gets closer, then use that history to set buffers on future estimates and fixed-fee proposals.
Illustrative example: the Shrinking Horizon. An enterprise client plans a core systems modernization. The delivery team saves four forecasts before kickoff. At 8 weeks out, the plan is 1,200 role-hours starting June 1 at a 42% expected margin. At 4 weeks out, the client's security team adds 40 compliance requirements and kickoff moves to June 15. At 2 weeks out, discovery reveals legacy tech debt. The project finally starts July 20 and uses 3,100 hours. Because the fixed fee was based on the 8-week estimate, the margin falls to 11%.
Forecast error % = |forecasted demand - actual demand| / actual demand x 100
Forecast error by horizon (illustrative)
| Horizon | Forecast role-hours | Hours error | Planned kickoff | Start-date error | Expected margin |
|---|---|---|---|---|---|
| 8 weeks out | 1,200 | 61.3% | June 1 | 49 days | 42% |
| 6 weeks out | 1,450 | 53.2% | June 1 | 49 days | 38% |
| 4 weeks out | 1,900 | 38.7% | June 15 | 35 days | 31% |
| 2 weeks out | 2,400 | 22.6% | July 1 | 19 days | 22% |
| Actual outcome | 3,100 | - | July 20 | - | 11% |
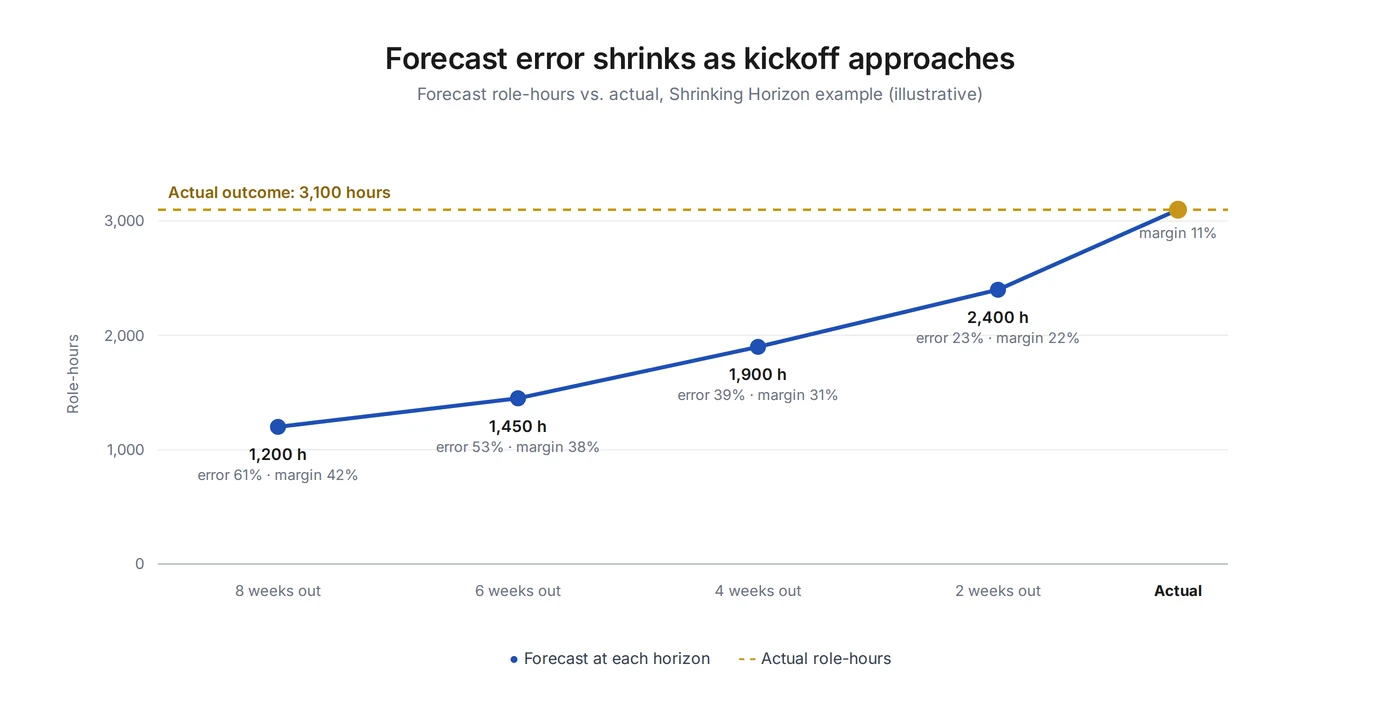
Save your forecast at fixed horizons (for example 2, 4, 8 and 12 weeks) so you can compare them later. Track role-hours error, start-date error and margin error separately, because one blended number hides what went wrong. Use your historical error to set buffers: wider ranges on far-out estimates and fixed-fee proposals, tighter ranges near kickoff. For high-uncertainty work, sell a paid discovery phase before you commit to a detailed fixed-fee delivery baseline.
The feedback loop depends on comparing plans with what actually happened. Our guide to planned vs. actual hours covers how to set this up at the time-tracking level.
Decision implication: start saving forecast snapshots now; after one or two quarters you will know how much to trust an 8-week estimate.
Hiring Capacity Is Not the Same as Hiring Headcount
A signed offer does not add capacity. Capacity arrives when the new person can do the work at the required level. Plan hiring on time-to-useful-capacity (TTUC), not on time-to-fill.
Time-to-useful-capacity (TTUC) = approval and requisition time + recruiting time + candidate notice period + onboarding and access + ramp to productive autonomy
Illustrative example: the Day 40 illusion. Talent acquisition celebrates hiring a Senior React Native Engineer in 38 days. The operations timeline tells a different story. The requisition opens on day 1. The candidate accepts on day 38. After a 30-day notice period, they start on day 68. Hardware, repository access and client security vetting take until day 75. After three weeks of shadowing and domain onboarding, they complete their first complex task alone on day 105. The recruiting dashboard shows 38 days. The delivery team lived with a gap of 105 days, and for 67 days after the "successful hire" they paid overtime and delayed sprint goals.
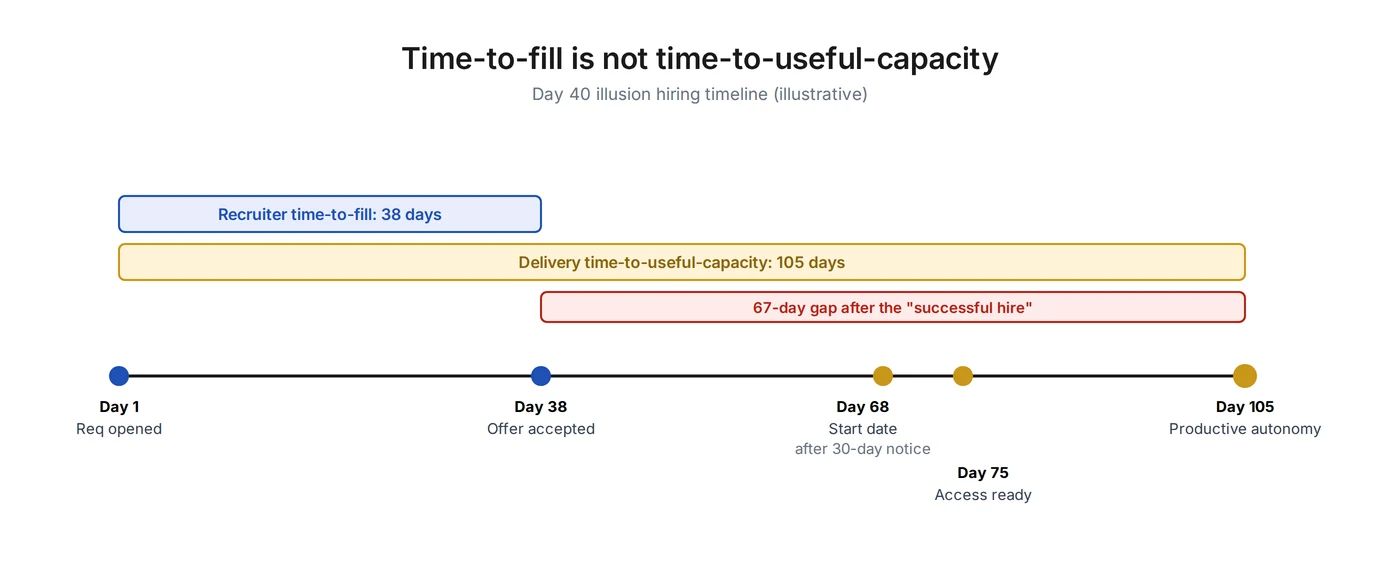
Time-to-fill usually ends when a candidate accepts an offer (some companies use the start date). For context, SHRM's 2025 benchmarking, based on more than 2,300 members, describes median time-to-fill, from requisition to offer acceptance, as roughly a month and a half for both executive and non-executive roles. Capacity planning cares about what happens after that. For enterprise client work, equipment, background checks, security clearance, client onboarding and domain ramp-up can add material delay. Use your own history for each step; generic benchmarks are not a planning input.
Latest requisition date = forecasted gap start - expected TTUC - uncertainty buffer
Example: your role forecast shows a persistent Lead Data Architect gap from February 1, 2027. Your TTUC for that role is 105 days and you add a two-week buffer. You need to open the requisition by October 5, 2026. If you wait until the gap is visible in current utilization, you are already four months late.
Contractors can bridge the gap, but model the cost first: the rate premium, onboarding time, knowledge continuity and the effect on project margin.
Decision implication: trigger hiring from the future gap date minus TTUC, not from today's utilization.
Turn Capacity Gaps Into Decisions
A capacity plan is only useful when it changes decisions. Match each type of gap to a default action, and check the listed factors before you act.
Capacity gap decision matrix
| Gap pattern | Likely action | What to check before acting |
|---|---|---|
| Short, skill-specific gap | Reallocate, subcontract or borrow a specialist | Project continuity, contractor rate, security, margin |
| Persistent role gap with strong pipeline | Start hiring | Pipeline calibration, TTUC, backlog duration, cash position |
| Temporary company-wide spike | Freelancers, partner network or resequence work | Duration, margin, client start flexibility |
| Weak demand or excess capacity | Redeploy to pre-sales, training or internal IP; slow hiring | Pipeline quality, skill mismatch, upcoming roll-offs |
| One project creates a disproportionate constraint | Re-scope, phase, move kickoff or change the team mix | Contract terms, client priority, margin, SLA |
| Low-margin work blocks higher-value demand | Portfolio or commercial decision | Contribution margin, strategic account value, penalties |
Excess capacity is also a gap. If you see a bench building up in one role, our guide to bench management covers how to redeploy people and protect utilization.
Decision implication: give every red cell in your capacity plan an owner, an action and a deadline.
Calculate the Economic Cost of Being Short
A capacity shortage costs more than one missing salary. Add up the incremental costs it creates, but count each effect only once.
Incremental shortage cost = contractor premium + incremental overtime + contractual delay or penalty cost + contribution margin of work declined or delayed + incremental replacement or attrition cost (where evidenced)
Illustrative example: the true cost of a shortage. A firm wins a $600,000 modernization contract for a regional bank. In sprint three, the lead Site Reliability Engineer resigns and there is no internal SRE bench. Over six weeks, the firm hires an emergency contractor at $250 per hour for 320 hours ($80,000). Two developers log 120 hours of overtime ($18,000), and one resigns two weeks later. A milestone slips four weeks and $300,000 of billing moves to the next quarter. Project gross margin falls from a planned 45% to 14%. Leadership also declines a $180,000 fixed-bid proposal from an existing client because nobody can oversee the SRE work.
The headline figure for this scenario is $278,000: $80,000 contractor cost + $18,000 overtime + $180,000 declined work. That is a useful wake-up call, but it mixes costs with revenue. A cleaner calculation looks like this:
Shortage cost: headline vs. clean accounting (illustrative)
| Item | Headline | Clean accounting | Why |
|---|---|---|---|
| Contractor spend | $80,000 | $80,000 or less | Strictly, only the premium over the departed employee's cost for the same hours is incremental. |
| Overtime | $18,000 | $18,000 | Direct incremental cost. |
| Declined work | $180,000 | $72,000 | Use contribution margin, not revenue. At an assumed 40% contribution margin: $180,000 x 40%. |
| Delayed billing | Not added | Not added | $300,000 moved to next quarter is a cash-flow timing effect, not a permanent cost. |
| Margin compression | Not added | Not added | 45% to 14% on $600,000 is about $186,000 of lost margin, but it already includes the contractor and overtime costs. Adding it would double-count. |
| Attrition | Not added | Add if evidenced | Replacement cost for the resigned developer, if you can measure it. |
| Total | $278,000 | About $170,000 plus attrition cost | Still a strong business case for planning ahead. |
Even the conservative figure is large compared with the cost of keeping a second SRE partly allocated or having a pre-vetted contractor ready.
Decision implication: price your top three single points of failure using this formula, then decide which ones justify bench depth or a standby contractor.
The Weekly and Monthly Capacity Planning Cadence
Capacity planning works as a routine, not a one-time project. Update the data weekly, recalibrate monthly and review structure quarterly, with a clear owner for each input.
Weekly, update allocations, PTO, project changes, pipeline movement, start-date changes and immediate bottlenecks. The weekly review should focus on decisions for the next 4 to 8 weeks, not on reading every line of the plan. Monthly, recalibrate pipeline conversion rates, review forecast accuracy by horizon, look at bench by role, and review hiring triggers and contractor exposure. Quarterly, validate the role mix, utilization targets, hiring plan, service mix and structural bottlenecks.
Who owns what in capacity planning
| Owner | Responsibility |
|---|---|
| Sales | Opportunity quality: stage, expected start, deal size |
| Delivery leads | Demand estimates by role and duration |
| Resource or operations manager | The capacity model and the weekly review |
| Finance | Economics: rates, costs, margin impact |
| Practice leads | Skills data and substitution rules (who can cover which role) |
Accurate plans also depend on the people closest to the work. Consultants and account teams should update their own allocations weekly and log new opportunities they spot at clients, both tentative and confirmed. Recognition and incentives help keep this habit alive. For how operations leaders get this visibility, see how consulting COOs get visibility into capacity, sales time and staffing.
Suggested Weekly Capacity Meeting Agenda
Work through six questions in order. First, what changed since last week? Second, which roles or skills are red in the next 4, 8 and 12 weeks? Third, which pipeline deals materially affect those gaps? Fourth, which people are rolling off projects or exceeding target allocation? Fifth, which hiring, contractor or re-scoping decisions need an owner today? Sixth, which assumptions changed and should be recorded for forecast accuracy?
Decision implication: keep the weekly meeting to 30 minutes by reviewing only red roles and pending decisions.
Capacity Planning Spreadsheet vs. Software
A spreadsheet is enough when one person can keep supply, demand, PTO and pipeline current without reconciliation becoming the job itself. Move to software when the manual work and the errors cost more than the tool.
Spreadsheets usually start to fail when several planners edit the plan at the same time, or several teams share a small pool of scarce specialists. They also break when CRM pipeline data has to be re-keyed into the plan every week, when skills live in a separate matrix that nobody keeps in sync, and when planned hours are not connected to actual hours, so forecast error is never measured.
Company size is only one factor. A 25-person firm with many specialists and a fast-moving pipeline can outgrow a spreadsheet sooner than a 60-person firm with stable retainers. Look at how many planners you have, how specialized your roles are, and how many systems you reconcile by hand. Our guide to moving from spreadsheets to integrated resource planning covers the transition, and our overview of resource management software explains what to look for in a tool.
Where Operating fits. Operating (operating.app) is resource planning and capacity software for consulting and professional services firms. As of September 2026, its capacity planning adds up committed and tentative work and sets it against the hours your team has by role, skill or team. With the HubSpot integration, deals that reach the pipeline stages you choose are imported as tentative projects, together with the deal amount, probability and close date. Salesforce and Pipedrive integrations are also available, and Microsoft Dynamics 365 connects through a partner or the REST API. Operating also includes a skills view, utilization reporting, and analysis of planned vs. actual hours. One honest limit: Operating imports the probability from your CRM, so calibrating those probabilities against your win history is still an analysis step your team owns.
Decision implication: list the manual reconciliation steps in your current process; if they take more than a few hours a week or cause missed gaps, evaluate software.
Common Agency Capacity Planning Mistakes
The most common mistake is planning on total hours instead of role and skill availability. Close behind are treating CRM probability as truth without calibration, using a single forecast with no conservative, base and upside scenario, and waiting for a contract signature before considering likely demand. On the hiring side, firms trigger recruitment from current utilization rather than future gaps, measure time-to-fill instead of time-to-useful-capacity, and ignore PTO, notice periods, onboarding, access and ramp-up. Finally, many optimize only for utilization while ignoring margin and delivery risk, never compare forecasts with actuals, and keep sales, resourcing, time and finance in disconnected systems.
Agency Capacity Planning Checklist
Your capacity plan is in good shape when every person has a working calendar, FTE, leave, role, seniority and skills recorded, and every active project has expected demand by role and period. Every material pipeline opportunity should have an expected start, duration, role demand and calibrated probability, and tentative allocations should be kept separate from confirmed ones. You should be able to drill company-wide capacity down into role and skill bottlenecks, and you should measure forecast error at consistent horizons. Hiring decisions should use time-to-useful-capacity, every capacity gap should have a decision owner and a deadline, planned hours should be reconciled with actual hours, and margin impact should be checked before you use contractors or overtime.
FAQ
What is agency capacity planning?
Agency capacity planning is the process of comparing the usable hours and skills your team will have with the work you have committed and the work you are likely to win. It is done by role and time window, not only for the whole company. The output is a set of decisions: accept or reschedule work, bring in contractors, redeploy people or hire. Good capacity plans also account for pipeline uncertainty and hiring lead time.
How do you calculate agency capacity?
Start with gross capacity: FTE x working days x paid hours per day. Subtract holidays, PTO and known leave to get available hours. Subtract internal commitments and a small non-delivery reserve to get usable delivery capacity. Apply your target billable utilization to available hours to get target billable capacity, and check that it stays below usable capacity. Finally, repeat the calculation for each role and skill that can block delivery.
What is the difference between capacity planning and resource planning?
Capacity planning asks whether you have enough of the right capacity for the work ahead, by role, skill and week. Resource planning asks who specifically works on what, and when. Capacity planning supports decisions like accepting work and hiring. Resource planning assigns named people to projects. Most firms need both, with capacity planning looking further ahead.
How far ahead should an agency forecast capacity?
Use several horizons. The next two weeks drive allocation. Four to eight weeks drive rebalancing and start-date changes. Twelve to sixteen weeks drive hiring and contractor decisions. Six to twelve months drive workforce strategy. Your longest practical horizon should be at least as long as your time-to-useful-capacity for key roles, and certainty should be treated as lower the further out you look.
Should sales pipeline be included in capacity planning?
Yes. If you wait for signed contracts, you will discover gaps too late to hire or contract in time. Include pipeline deals as tentative demand, converted into hours by role with an expected start date. Keep pipeline separate from committed work, weight it with calibrated probabilities, and do not reserve people at 100% for unsigned deals.
How do you weight pipeline demand?
Multiply the estimated delivery hours for each role by a calibrated win probability, then sum the results by role and time window. Calibrate probabilities by checking what share of past deals at each CRM stage were actually won, ideally over 12 to 24 months. Use weighted totals for bench and hiring planning, and use scenarios to test whether you can staff large deals if they close.
What is a good utilization rate for an agency?
There is no universal good rate. The right target depends on role, business model, cost base, pricing and margin goals. Leaders and practice heads carry sales and management work, so their targets are lower than those of delivery staff. For context, SPI Research's 2026 benchmark reported average billable utilization of 66.4% in 2025 across 509 professional services organizations. Derive your own targets from your economics.
Why can an agency have spare capacity but still be understaffed?
Because spare hours may belong to the wrong roles. A firm can have hundreds of free hours across junior developers and testers while every lead architect is fully booked. Skills, seniority, certifications, security clearance, time zones and client continuity all limit who can do the work. This "ghost capacity" is why you should plan by role and skill, not only by total hours.
When should an agency start hiring?
Start hiring when your calibrated forecast shows a persistent gap in a role, and do it early enough to cover your time-to-useful-capacity. The latest requisition date is the forecasted gap start minus expected TTUC minus an uncertainty buffer. Before you hire, check pipeline calibration, backlog duration and cash position, and compare hiring with contractor or rescheduling options.
What is time-to-useful-capacity?
Time-to-useful-capacity (TTUC) is the time from deciding to hire until the new person can work at the required level without close supervision. It includes approval and requisition time, recruiting, the candidate's notice period, onboarding and access, and ramp-up to productive autonomy. It is often much longer than time-to-fill, which usually ends at offer acceptance.
When should an agency use freelancers instead of hiring?
Use freelancers or partners for short or uncertain gaps, temporary spikes, or niche skills you need only occasionally. Hire when the gap is persistent, the pipeline is strong and calibrated, and the role is core to your service. Before using freelancers, model the rate premium, onboarding time, knowledge continuity, security requirements and the effect on project margin.
How do you measure capacity forecast accuracy?
Save forecasts at fixed horizons, such as 2, 4, 8 and 12 weeks before a project starts. When the work is done, calculate forecast error: the absolute difference between forecast and actual demand, divided by actual demand. Track role-hours, start-date and margin error separately. Use the error history to set buffers on future estimates and fixed-fee proposals.
How often should the capacity plan be updated?
Update the data weekly: allocations, time off, project changes, pipeline movement and start dates. Recalibrate pipeline conversion and review forecast accuracy monthly. Review the role mix, utilization targets and hiring plan quarterly. The weekly update should be short and focused on decisions for the next four to eight weeks.
Can an agency do capacity planning in Excel or Google Sheets?
Yes, especially when one person can keep the plan current. A spreadsheet can hold people, calendars, roles, skills, projects and pipeline, and the formulas in this guide work in any spreadsheet. Problems start when several people edit the plan, pipeline data must be re-keyed from the CRM, skills live in a separate file, or planned hours are never compared with actual hours.
When should an agency use capacity planning software?
Consider software when maintaining the spreadsheet becomes the work itself: several planners, shared specialists, weekly re-keying of CRM data, disconnected skills data, or no link between planned and actual hours. Company size is one factor, but specialization, pipeline volatility and the number of systems you reconcile matter more. Look for tentative and confirmed allocations, role and skill views, CRM integration and planned vs. actual reporting.
Plan Capacity Before It Becomes a Crisis
Agency capacity planning works when you look at the right unit (role, skill and week), use honest probabilities, and act early enough to change the outcome. Capacity is only real when it is usable, skill-fit, available in the required time window, and economically sensible against the demand you expect to win.
Your next step: pull 12 to 24 months of won and lost deals from your CRM and calculate the observed conversion rate for each stage. It is the fastest way to see how much phantom demand is in your current plan.
If you want to see committed and tentative work against capacity by role and skill, with your CRM pipeline connected, explore capacity planning in Operating.
Sources and Methodology
Illustrative examples. The five scenarios in this guide (Ghost Capacity, the 70% deal, the Day 40 hire, the Shrinking Horizon and the cost of a shortage) are illustrative. They show common patterns in professional services firms. They do not describe named Operating customers, and their figures are not observed customer outcomes. The worked calculations and calibration tables are also illustrative.
Pipeline probabilities. Calibrate pipeline probabilities to your firm's own historical close data. Do not copy stage percentages from generic benchmarks or from this guide.
Product information. Operating product details were checked against Operating's product pages and help center on September 26, 2026.
Sources
Certinia: Analyzing the 2026 SPI Research Professional Services Maturity Benchmark Report (billable utilization 66.4% in 2025, 509 organizations)
SHRM: The State of Recruiting 2025 (median time-to-fill)
Accelo: Resource forecasting and planning (planning horizons)
Teamwork: Forecast delivery capacity from the sales pipeline (rolling forecast window)
Supervisible: Capacity planning vs. resource planning
Operating: Resource management
Operating help center: HubSpot CRM integration
Written by Lauri Eurén, CEO of Operating. Last updated September 26, 2026.