


Utilization, revenue and project financials, with plans beside actuals
Follow planned versus actual utilization, forecast margin and revenue, and drill into any project's financials while the work is in flight.
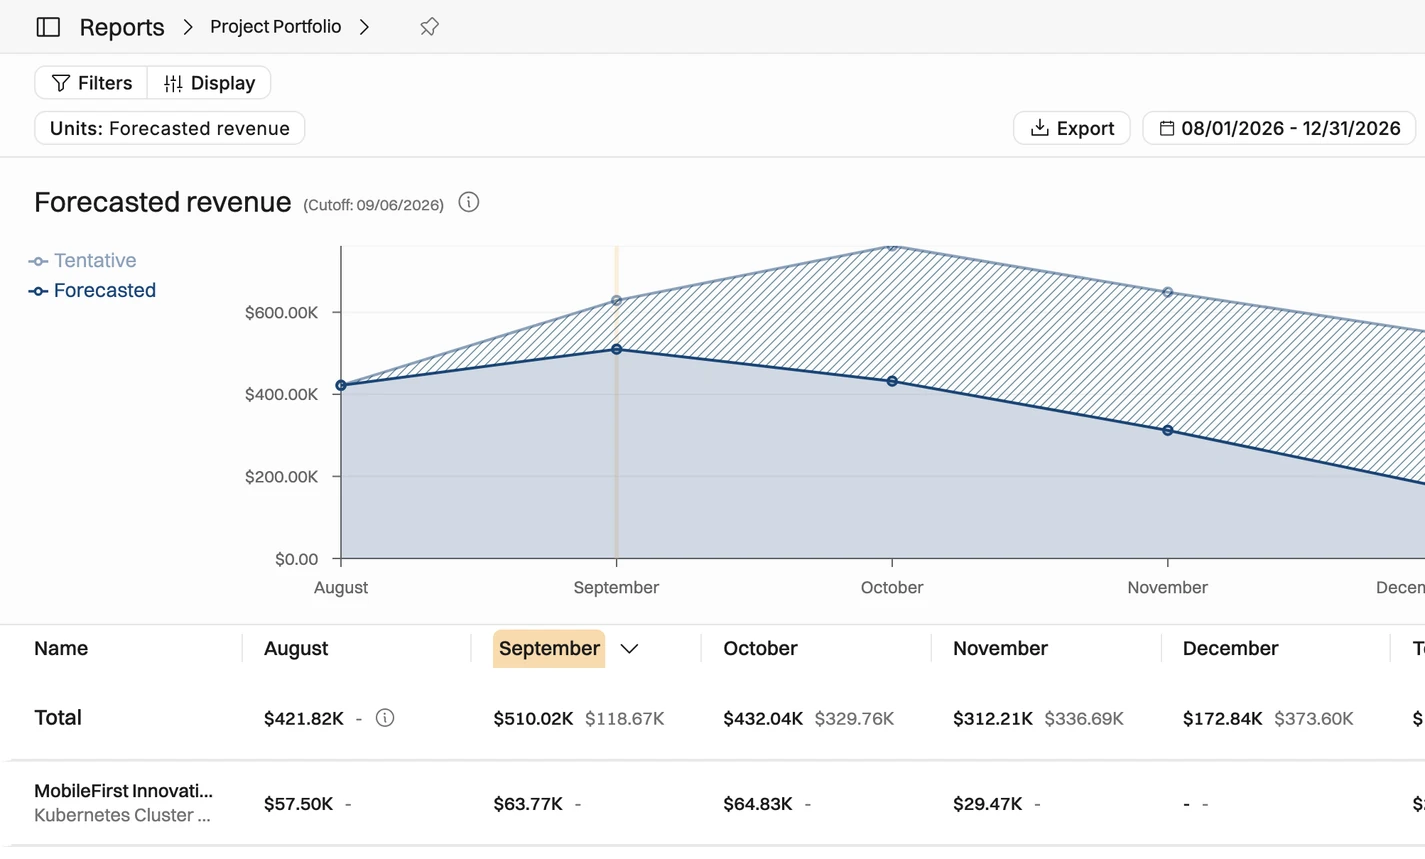

Capacity forecasting made simple
See your team's future utilization at a glance — tentative and confirmed, in hours or percentages, filtered by role, skill, or team.

Forecast revenue, compare to actuals
Forecast confirmed and tentative revenue per individual, project, and client — then see it next to actualized numbers.

Granular project financials reporting
Watch hours, labor costs, and revenue accumulate in real time, and compare planned project revenue to actualized spend.
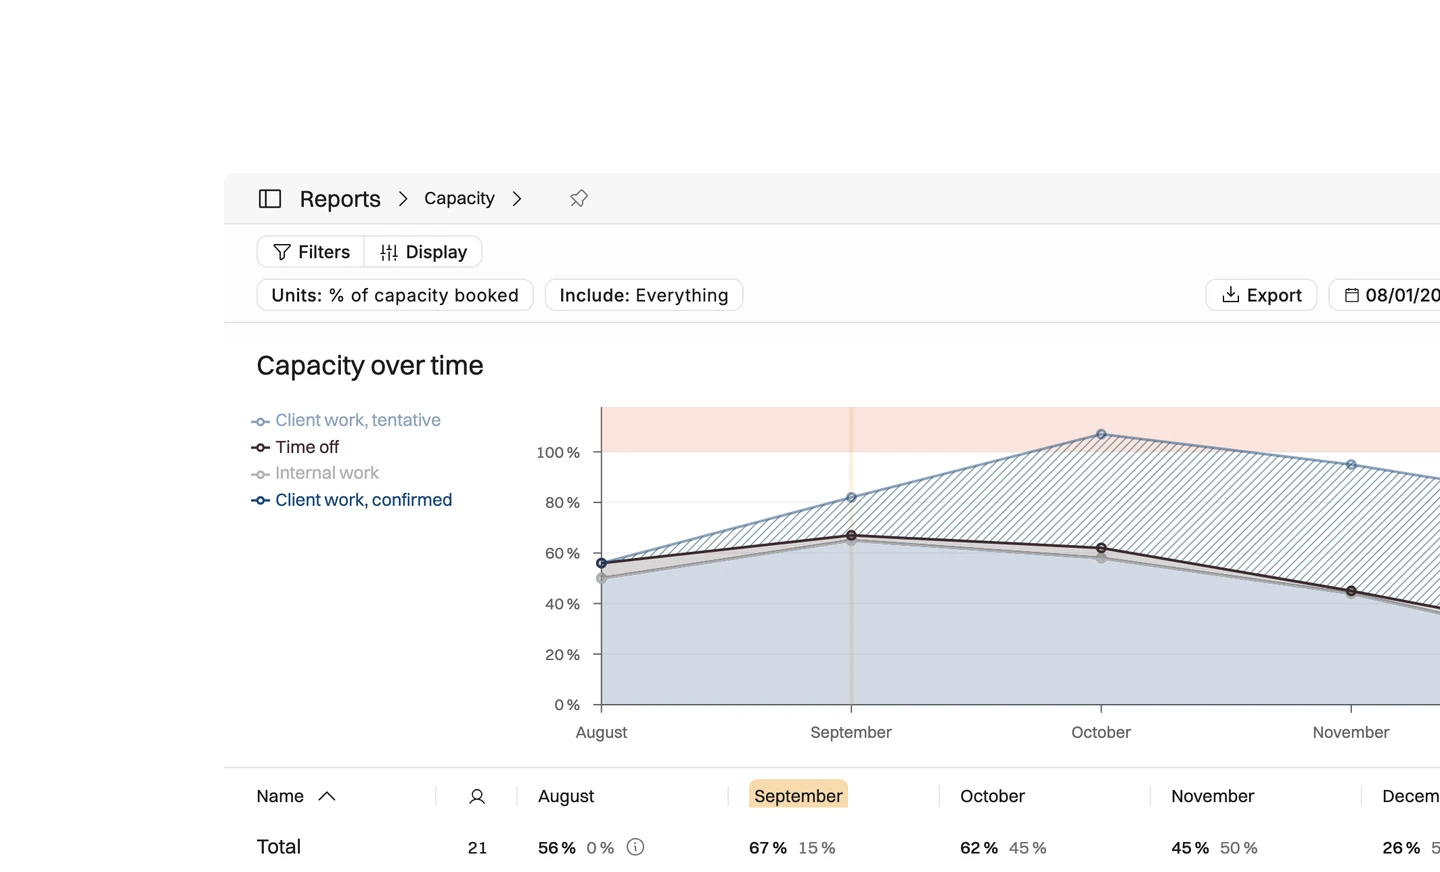
Capacity planning
Forecast your team's expected capacity and utilization. Filter and group data to spot trends. Know who to hire and what to sell.
View tentative and confirmed utilization
Weigh tentative utilization with deal probabilities
View the data in hours, utilization percentages or time available, to see bench time.
Filter by roles, skills, teams and group the data to compare utilization over subsets of people
Spot hiring gaps in advance





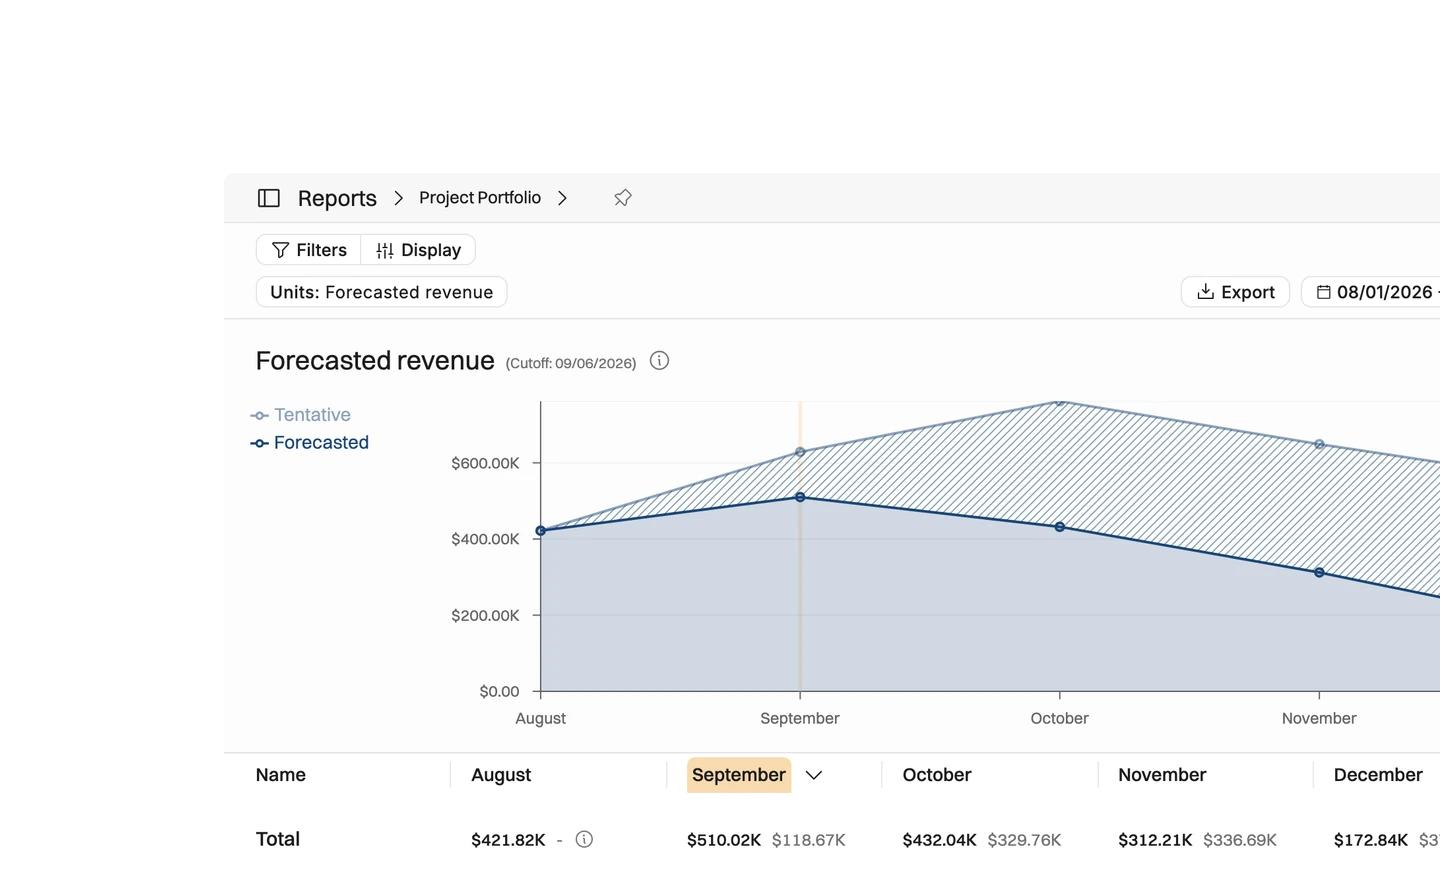
Forecast revenue and margin
Forecast revenue for individuals, projects, and clients and recognize revenue at the right time.
Forecast both confirmed and tentative revenue, profits, and margin
Connect to your CRM to get real-time numbers from your pipeline
Support for time & materials and fixed price-based revenue forecasting with different revenue recognition models
See planned and actualized revenue per client per project
Drill down to team members, and to the individual tasks, within a project
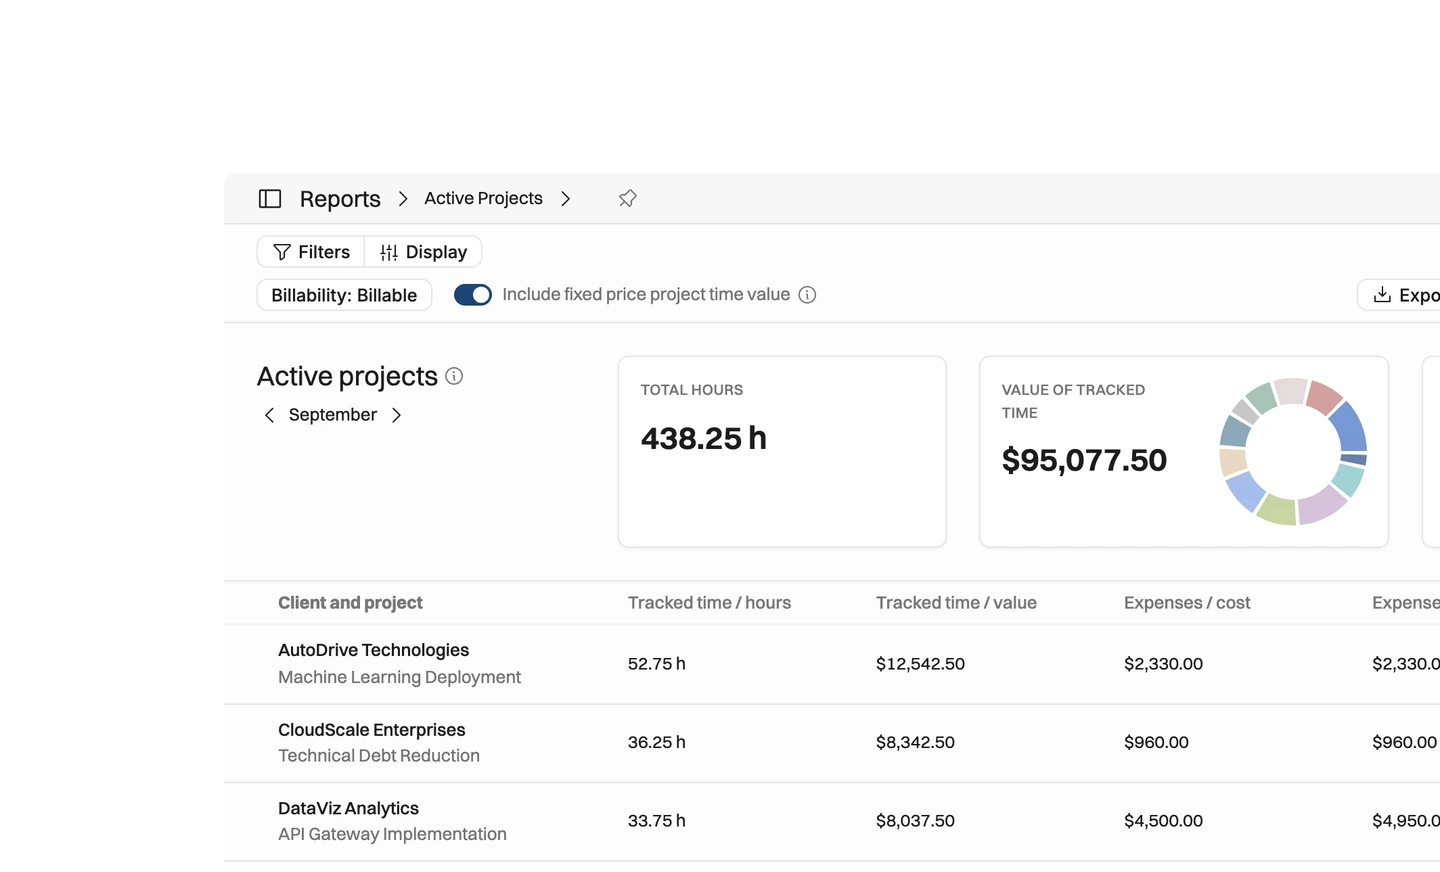
Financials for active projects
Drill down to the numbers of your active projects
See how each project's financials stand for the month
Compare planned project revenue to actualized spend
See project hours, labor costs, and revenue accumulate in real time and assess project health
Multi-currency and exchange rate support
Export summaries for your clients or for invoicing
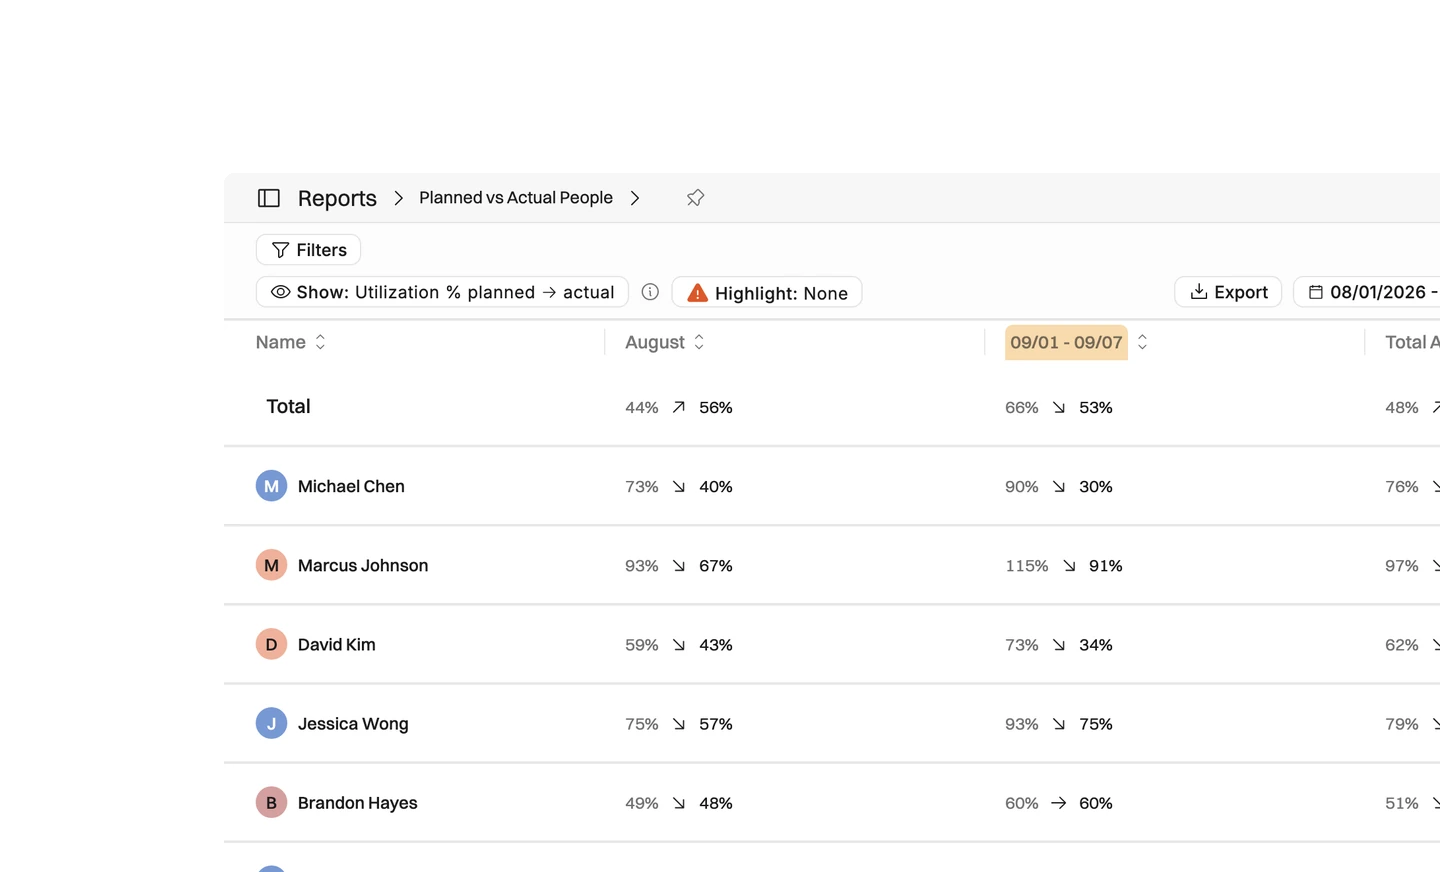
Planned vs. actual utilization
Compare planned utilization with actual time spent to identify revenue leak
See your own or your team's utilization, or compare the whole company's actual utilization to see if you're hitting your monthly goals
Project managers get the same planned versus actual view across all their projects
Compare planned vs. actual revenue, identify work left unbilled, and spot budget overruns
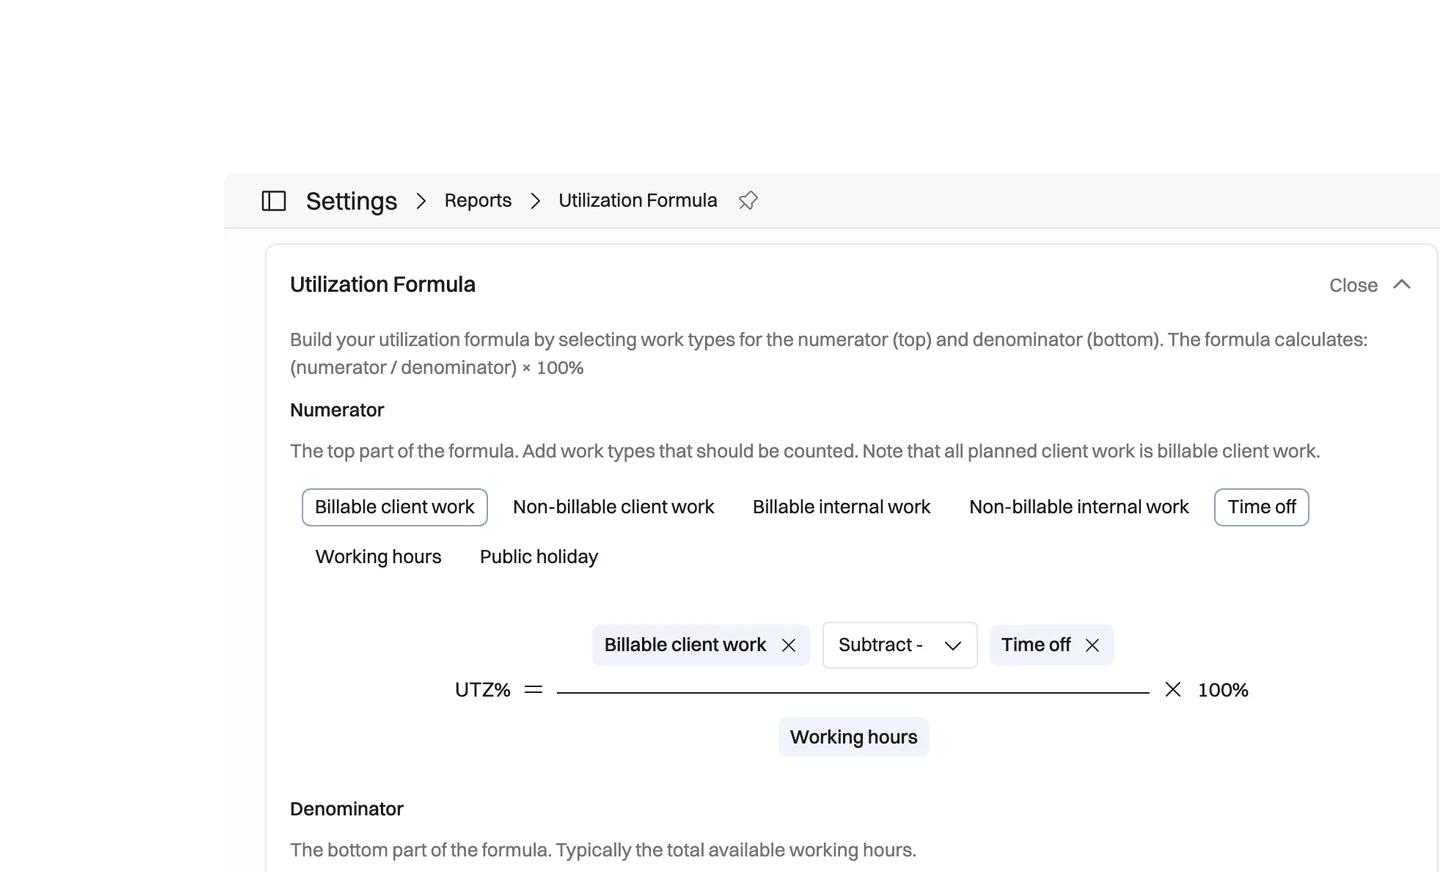
Build your own utilization formula
Based on the type of business you're running, and how your financial reporting is set up, you might think of utilization differently than the consulting firm or agency next door.
We'll let you customize your own utilization formula.
One source of truth for utilization: no more arguing over the formula
Choose what to include in the numerator to tell Operating what counts as billable work
Configure the denominator to e.g. include or exclude time off
Why report on plans and actuals together?
A plan you never check against what actually happened is only a guess.

Utilization, revenue, and project financials all start as forecasts. Until you put actualized numbers beside them, you cannot tell whether a month went well or where the revenue quietly leaked out of your projects along the way.
That is why every report here shows the plan and the actuals side by side, from a single consultant's bench time up to the whole portfolio.
Capacity forecasting tells you where utilization is heading. Revenue forecasting tells you what that capacity is worth. Project financials tell you what it actually cost. Read them together and a burn up chart stops being a report and becomes a reason to re-plan.
We also know that no two firms count utilization the same way. Rather than force our definition on you, we let you build your own formula, filter by role, skill, or team, and view the same data in hours, percentages, or time available — whichever your finance team already trusts.


Get the Operating Routine for resource planning
A weekly routine for staffing and capacity, written by people who ran it in their own firms. It gives your resource planning meeting a fixed agenda and a short list of numbers to check. Get the guide.
Thank you!
Get the Staffing Routine by clicking below.
Download guide